
Chapter 12: Variable Control Charting
Overview
This chapter is an introduction to SPC Control Charts. A control chart is a graph used to see how a process changes overtime. Data are plotted in chronological order with a central link through the middle to show the average. Control charts are usually used in pairs, where the top chart monitors the average and the bottom chart tracks the range of distribution (ASQ, 2022).
A control chart is used in one of the following scenarios (ASQ, 2022):
- Controlling ongoing processes and adapting as needed
- Predicting the range of outcomes
- Decide if a process is stable
- Analyze patterns of variation
- Determine the direction of improvement projects
General Charting Information
There are two kinds of data, variable and attribute data. Attribute data are measurements like static numbers or can be described as either yes or no. Where variable data are measures that can be manipulated in a meaningful way, like temperatures, length, width, etc (Khillar, 2021)
Slide the center bar to learn more about the difference between these types of data (Khillar, 2021).
Before conducting a sample, there are some factors that may influence the decision. These are: size of the population, cost involved, and convenience (Sharma, 2019). A sample size should have a minimum of two subgroups, but the preferred number is five subgroups. But, the manufacturing process may dictate the sample size. Sample frequency is usually determined by the average number of parts or time between tool changes divided by five.
Average and Range Charts

Average charts are control charts where the subgroup average (x-bar) is used to evaluate the stability of the process (ASQ, 2022). A range chart (r-chart) “evaluates the stability of the variability within a process” (ASQ, 2022).
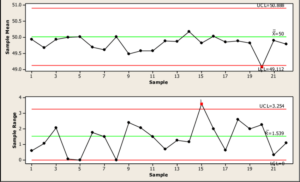
Three-sigma limits are calculations of data that are within three standard deviations from an average. This generally refers to process that are efficient with quality outputs. Three-sigma limits set the upper and lower control limits in control charts which thereby establish limits for a controlled process (Kenton, 2022). Generally, you can expect 99.7% of the outcomes to occur within the 3-sigma limits. However, even with a perfectly centered process, there is still a .3% change that a product will be produced beyond the +/- 3 sigma control limits. Two-sigma zones may also be used, which means that 95.5% of outcomes will occur in this area.
Rules for adjusting
There are a few possible rules for adjusting, in order to maintain control. This is not an exhaustive list. Only use the criteria that make sense for your process. Furthermore, over-adjustment is not beneficial for the sampling.
- One of the sampled points is in Zone 3
- Seven points are on one side of the center line.
- Six points are trending up or down.
- 14 points in a row alternating above and below the center line
- Two of the three points are in Zone 2.
Individuals and Moving Range Charts
Individual charts are very simple. They show change in process centering. These charts are not as effective at detecting small changes like a Mean chart. But they can show changes in variability with careful attention to the data. To set up this type of chart, the center link is at the middle of the specification limits or is the mean of the previous study (or a different, suitable value). Moving range (MR) is x or the previous x-value. Individual control limits are three sigma from the center line and warning lines are placed at two sigma from the center line.
Average and Sigma Charts are charts that compare the range and the standard deviation of a process. This is used for large subgroups, like nine or more.
References
Andriani, Debrina & Fikri, Ahmad & Nur’aini, Shintya. (2018). ANALISIS PENGENDALIAN KUALITAS PERSENTASE KADAR AIR PRODUK WAFER STICK PADA INDUSTRI MAKANAN RINGAN. Industri Inovatif : Jurnal Teknik Industri. 8. 10-17. 10.36040/industri.v8i2.522.
American Society for Quality (2022). Control chart. ASQ. Retrieved on August 8, 2022 from https://asq.org/quality-resources/control-chart
Argolytics (2021, December 22). What is a moving range control chart? [Video]. YouTube. https://www.youtube.com/watch?v=lZ4hD0sPlcE
Bakeer, F., Bleed, S., Gendela, A. (2017). Use of control charts for adjust the quality of the weights of the cement bags produced: Applied study of the free market for the sale of cement in Zliten-Libya. Quality Control. https://www.researchgate.net/figure/Chart-of-arithmetic-mean-and-range-R_fig2_326834878
Kenton, W. (2022, May 31). Three-sigma limits. Investopedia. Retrieved on August 8, 2022 fromhttps://www.investopedia.com/terms/t/three-sigma-limits.asp
Khillar, S. (2021, October 29). Difference Between Variable and Attribute. Difference Between Similar Terms and Objects. Retrieved August 8, 2022 from http://www.differencebetween.net/technology/difference-between-variable-and-attribute/.
