
Chapter 7: Introduction to Quality
Overview
The text now will shift from lean manufacturing to SPC and Quality. There are some terms to know as the content shifts. First, is quality. Quality has many definitions, ranging from “degree of excellence” (Merriam Webster), “fitness for use” (NVT QC, 2022), “producing products and services to a predictable degree of uniformity and dependability which meets the customer expectations (Khawaja, 2018), and “conformance to requirements” (British Library). Here, the definition of quality is that it meets the requirements of the customer.
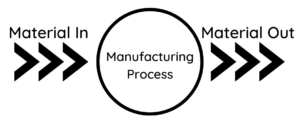
Next is process. What is a process? A process is a transformation of inputs into desired outputs like products, services, and information. Anything can be a process as long as it has an input, change, and an output.
And finally, a control. A control is making a process the way it needs to behave in order to achieve a desired output. In order to have control, an outcome must have the capacity to be recreated. Manufacturers have to study the process to determine if a good part can be produced. Then, data must be collected to analyze how the inputs impact the outputs; this is also known as feedback. And finally, the data is tested to see if the outcome can be recreated. Control must happen at the process input, not afterwards in an inspection process.
Product Quality
There are two key aspects to product quality: design and conformance to design.
- Design asks whether the product design or specifications meet the intended goal. This includes products designed to customer specifications, like in custom work, but also meets the parameters for intended use.
- Conformance to Design asks how well the product achieves the design criteria.
When there are problems, there are some things to consider when determining if the problem is the design or the manufacturing process:
- Weight of the product that routinely exceeds customer criteria.
- Large scrap costs are routinely produced driving up overall cost to the customer.
- Final inspection identifies parts outside of the allowable dimension tolerances.
Cost of Quality
Cost of quality is often referred to as COQ or COPQ (Cost of Poor Quality). Often the costs are hidden costs, which varies by company and industry, but typically exceeds 10% of sales. Learn more about the Global Cost of Quality by watching this video provided by ASQ (2022).
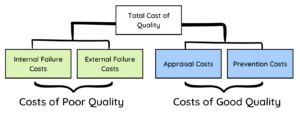
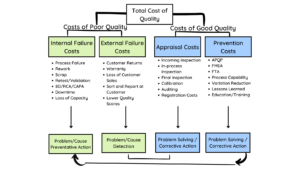
Costs of Poor Quality
Internal Failure: Internal failure costs includes many components like the following: process delay, rework, scrap, retest/validation, 8D/RCA/CAPA, downtime, and loss of capacity. These things can be corrected through problem solving and strategic action.
External Failure: External failure are things that are beyond the company’s control, but can usually be fixed with problem solving and corrective action. These items include customer returns, warranties, loss of customer sales, sort and repair at customer, lower quality scores.
Costs of Good Quality
Prevention: Preventative action is taking a problem, finding the causes, and correcting the issues. Some of the preventative measures are APQP, FMEA, FTA, process capability, variation reduction, lessons learned, education, and training. Preventative action can mitigate the need for corrective action later with external failures.
Appraisal Costs: Appraisal costs involve problem and causes detection and is related to the eventual problem solving and corrective action involved in internal failures. Appraisal costs include inspections (incoming, in-process, and final), calibration, auditing, and registration costs.
Framing
SPC stands for Statistical Process Control. This uses data to understand the process, monitor it, and control it to make continuously good products. SPC is a prevention tool and/or cost. SPC aids in the minimization of waste, or bad products, being produced. It requires statistical studies of the process, which change the process settings (inputs) when then data (outputs) support that change.
History of SPC
SPC all began in the United States during the late 1700s when there was no standardized part production. In 1798, Eli Whitney received a contract for 10,000 muskets. He was convinced he could standardize this production process. This was the first production run and of 700 muskets produced only 14 guns were free from defects. It failed because the process lacked quality and control. There were no engineering tolerances.
In the early 1800s, quality control was introduced. A specification of materials, dimensions, and finish product were created. A quality inspection was conducted by Quality Control. Bad parts were evaluated to determine why they were bad, however, as long as a high percentage of good parts were produced, the process was not considered important. This was a more reactive process, rather than preventative measure to proactively combat problems, they were reacting after the problems occurred.
But then, WWI came and something better needed to be developed so materials could be made in high volumes and shipped immediately, guaranteed to work. This is where statistical quality control or statistical process control began. Dr. Walter Shewhart was a physicist, part of the Western Electric Company’s inspection engineering department that supplied hardware for Bell Telephone Lab. With his probability distributions, he actually contributed to the WWI effort. In 1924, Shewhart created the first SPC control charts. He did this by measuring the heads of over 10,000 troops in order to design a standard headset. He arranged the head widths from small to large and marked the frequency of each size. He was intrigued to find a bell-shaped curve. His charts were eventually called the Shewhart Control Chart or X Bar and R Chart. Learn more about Dr. Shewhart from this article, remembering his accomplishments. (Smith 2009)
In 1926, H. Dodge and H. Romig developed acceptance sampling which determined how frequently parts should be checked for quality. In 1931, Shewart publishes “Economic Control of Quality of Manufactured Product”, the first publication on control in manufacturing. In 1942, the first training program on SPC was conducted at Stanford and lasted 10 days. This training was delivered by Eugene L. Grant, Holbrook Working, and Dr. W. Edwards Deming.
More history is shown below in the graphic, select each hot spot to learn more about each era.
References:
American Society for Quality (2022). Cost of quality. ASQ. https://videos.asq.org/cost-of-quality
British Library (n.d.) Philip Crosby. https://www.bl.uk/people/philip-crosby
Hills, R. (2015, June 17). Introduction to statistical process control [Video]. YouTube. https://www.youtube.com/watch?v=blTeXd8iCes
History Channel (2015, December 2015). Eli Whitney: Father of American technology [Video]. YouTube. https://videos.asq.org/cost-of-quality
Infinity MFG (2017, MArch 8). Quality (Part 1: Statistical Process Control) [Video]. YouTube. https://www.youtube.com/watch?v=e5g2NmIUdck
Khawaja, M. (2018, September 16). Quality management approaches: Deming, Juran, and Crosby. Linkedin. https://www.linkedin.com/pulse/quality-management-approaches-deming-juran-crosby-marryam-khan/
Merriam Webster Dictionary (n.d.). Quality definition. In Merriam Webster dictionary. Retrieved August 3, 2022 from https://www.merriam-webster.com/dictionary/quality
NVT QC (2022). Juran’s steps for quality improvement. NVT QC. https://www.nvtquality.com/white-papers/jurans-steps-for-quality-improvement/
Oakland, J. (2003). Statistical process control. (5th edition). Butterworth Heinemann. http://diliev.com/home/materiali/KHEA/referati/6812268-Statistical-Process-Control-eBook-VG.pdf
Smith, J. (2009). Remembering Walter A. Shewhart’s contribution to the quality world. Quality Magazine. https://www.qualitymag.com/articles/85973-remembering-walter-a-shewharts-contribution-to-the-quality-world
