
Chapter 13: Attributes Control Charting
Overview
Typically attribute are counted, not measured and the charting is usually different as well. There are four common charts: np, p, c, and u. First, np, which means the number defective. p means the percentage that are defective. c represents the number of non-conforming products. And u means the number of non-conforming per unit.
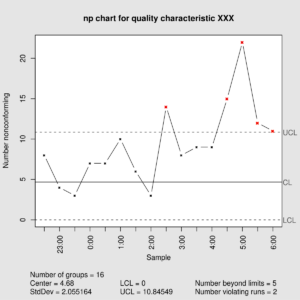
np – Number Defective charts
np charts are the easiest to use. These detail the number of defective parts. What is beneficial about these charts is that they are consistent to the sample size and consistent to the control limit. Here is an example of an np chart:
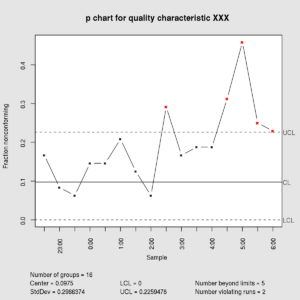
p – % Defective charts
p charts show a proportion of defective parts of the entire group. It is inconsistent with the sample size and the control limits vary with sample size. Here is an example of a p chart:
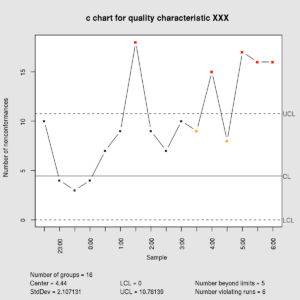
c – Number Non-conformities charts
c charts provide the number of non-conformities. It may not be possible to know the total number. It is consistent with the sample size (area, unit, etc.). It is also consistent with control limits. Here is an example of a c-chart:
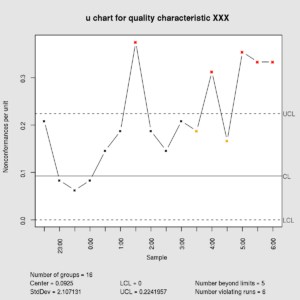
u – Number Non-conformities per Unit charts
u charts show the proportion of non-conforming items per unit produced. This is usually inconsistent with the sample size. Control limits will vary with the sample size. Here is a u chart:
References:
CQE Academy (2021, July 14). Attribute data control chart examples!! How to select/create the p, np, c, and u charts [Video]. YouTube. https://www.youtube.com/watch?v=p-gvwkHePaU
Montgomery, Douglas (2005). Introduction to Statistical Quality Control. Hoboken, New Jersey: John Wiley & Sons, Inc. p. 294. ISBN 978-0-471-65631-9. OCLC 56729567. Archived from the original on 2008-06-20. https://en.wikipedia.org/wiki/U-chart
Montgomery, Douglas (2005). Introduction to Statistical Quality Control. Hoboken, New Jersey: John Wiley & Sons, Inc. p. 289. ISBN 978-0-471-65631-9. OCLC 56729567. Archived from the original on 2008-06-20. Retrieved 2008-08-23. https://en.wikipedia.org/wiki/C-chart
Montgomery, Douglas (2005). Introduction to Statistical Quality Control. Hoboken, New Jersey: John Wiley & Sons, Inc. ISBN 978-0-471-65631-9. OCLC 56729567. Archived from the original on 2008-06-20. https://en.wikipedia.org/wiki/P-chart
Montgomery, Douglas (2005). Introduction to Statistical Quality Control. Hoboken, New Jersey: John Wiley & Sons, Inc. p. 279. ISBN 978-0-471-65631-9. OCLC 56729567. Archived from the original on 2008-06-20. https://en.wikipedia.org/wiki/Np-chart
