
Chapter 9: Introduction to Statistical Process Control (SPC)
Overview
In this chapter, more information will be provided regarding SPC. Specifically, content will be focused on the Law of Variation and capability studies.
Law of Variation
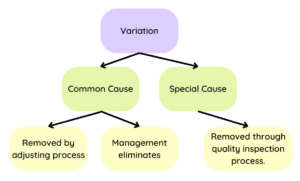
The Law of Variation is defined as “the difference between an ideal and an actual situation” (ASQ, 2022). Variability can occur in four main areas: special causes, common causes, tampering, structural variation. It is important to note that variation is common in every process (Singh, 2022).
In 1924, Dr. Shewhart developed a new way to deal with variation, identifying two causes of variation: Common Cause and Special Causes. Years later, Deming added tampering to the list of variations (ASQ, 2022).
Common cause is often called noise, which is just variation that is going to happen regardless. It’s inherent to the process (Singh, 2022) and likely cannot be avoided. Special cause is an outcome of unusual circumstances, adding instability to the process (Singh, 2022).
Capability Studies
A capability study is the “output of a process” that is expected to meet standards like customer expectations, specifications, or engineering tolerances (“Process Capability”, 2022). Capability studies are important to reduce the cost of production, reduce non-conforming products, and to promote customer satisfaction (Simion, 2017). Read a study about how this process is helpful for quality improvement here.
Capability studies are needed because they offer organizations much-need insight on how their production can attain their goals while saving costs (Duchek, 2020). A study is appropriate and should be put into place when the process controls are firmly established (“Process Capability”, 2022). A control chart will often determine when the process is “in control” and can be evaluated. are often used because it aids in the evaluation of potential. Subgroups are a group of units produced under similar or identical conditions. It’s essentially more data that is valuable for capability analysis (Heckman, 2012).
Best Practices
There are some best practices to consider in a capability study, things to remember while collecting the data.
- First, run a long-term capability study. Number all of the parts produced sequentially.
- Collect data in subgroups. An example could be 100 sample parts minimum, subgroups of five, 20-25 subgroups minimum.
- Use the regular production process, people, equipment, measurement tools, etc. The process should be exactly the same so it reflects a true measurement.
- Repeat the steps when the process is adjusted.
Theoretically, it is time to conduct a capability study of the process, create a histogram of the process data, and analyze the histogram. A little bit more information before creating the study about examples of changes and types of studies.
Examples of Changes to a Process Requiring a New Capability Study (Simion, 2017):
- Change in product material
- Change in process tooling
- Rearrangement of equipment
- Change of component/materials supplier
- Start-up after tooling has been inactive 12 months or more
- Product or process design changes
- Change in inspection methods/tools
Two Types of Capability Studies in the Manufacturing Process
Machine capability: this looks at only the variation from a specific machine or operation. This is used to qualify a machine for production. Typically, it is short-term study with minimum of 30-50 parts.
Process capability: this version includes all machines. The aim is to understand the combined variation from all sources. Typically, this is a long-term study, at least 30 days, and parts are randomly samples from the finished inventory.
Practice
Now, plan the study of the process. How many parts are needed? At minimum, there should be 25 subgroups and 100 parts total. Automotive preference is 300 consecutive parts and 100 subgroups; a minimum of 30 subgroups (or parts) are usually ran for initial runs. Increasing the quantity of data will more accurately reflect the process; again why subgroups are helpful additions to a capability study. The normal production process, people, equipment, and everything should be used in order to receive the right data on the process. Repeat the process when changes occur.
The next phases of the process will be to number and label all of the parts, measure and record all parts, collect and record stratification data, and keep all parts until data collection and analysis are complete. Often these parts are separated and treated as scrap until the process is approved. Customers may need samples for approval, as well.
 Now create a histogram. Remember that histograms vary by the location of the curve, the height of the peak and span of the curve, and the shape of the curve (symmetrical or skewed).
Now to analyze the histogram. Consider these things. A stable or in-control process has a consistent histogram that is predictable. The shape of the curve is consistent over time (and typically normal), the histogram is typically normal, but can be skewed. Only common cause variation is impacting the process, like normal wear in tooling. An unstable histogram or out-of-control process means that the histogram varies over time, the process is not predictable. Assignable cause variation at play, like broken equipment. Answer the following questions regarding predictable variability.
Review the charts below. Can you decide which chart is all data and which chart is broken into subgroups? Consider how this would be helpful in real-life scenarios. Move the bar to the right to see the first chart, Move the bar to the left to see the second chart.
Now some more information about the charts, to demonstrate why subgroups are helpful in data collection. These charts represent data collected on the type of learning materials used in three different groups (main campus, TrineOnline undergraduate, and TrineOnline graduate). This data does not tell the audience what kind of learning materials used, just counts how many courses are logged in the respective categories. The second chart has all of the subgroups. These subgroups provide more meaning to the data, showing which courses require a book, which are OER, zero cost, and so on. This provides significantly more meaning than the first chart. While the first chart does provide some information, it’s not necessarily the information needed. Subgroups offer that insight to what is really going on in an organization and can be applied to many environments.
Analyze the Data
There are certain measures of centrality used when analyzing data. These are , , and . From an manufacturing process perspective, how would this data be helpful in knowing whether you can and are making good parts?
There are also measures of spread: range and sigma. Range provides the variation between maximum and minimum values. Sigma is the standard deviation from the mean. Calculating sigma can be complicated as multiple equations can be used. Sigma is always an estimate and is always less than the true process standard deviation. Sigma is important because it tells us how much normal variation exists.
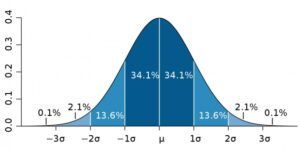
Interact with this simulator to engage with normal distribution (University of Colorado).
References:
American Society for Quality (2022). What is the law of variation? ASQ. https://asq.org/quality-resources/variation
Benchmark Six Sigma (2017). Process stability, process capability. https://www.benchmarksixsigma.com/forum/topic/34898-process-stability-process-capability/
Boston University School of Public Health (2016). Central limit theorem. The Role of Probability. https://sphweb.bumc.bu.edu/otlt/mph-modules/bs/bs704_probability/BS704_Probability12.html
Duchek, S. (2020). Organizational resilience: A capability-based conceptualization. Business Research, 13. https://link.springer.com/article/10.1007/s40685-019-0085-7
Heckman, E. (2012). Starting out with capability analysis. Minitab. https://blog.minitab.com/en/starting-out-with-statistical-software/starting-out-with-capability-analysis
Process Capability (2022). Wikipedia. https://en.wikipedia.org/wiki/Process_capability
Production Part Approval Process (2006). 4th edition.
Simion, C. (2017). Capability studies, helpful tools in process quality improvement. MATEC Web of Conferences, 121, https://doi.org/10.1051/matecconf/201712105008
Singh, V. (2022). Statistical process control (SPC) guide line. International Journal of Engineering Research and Technology, 11(5). https://www.ijert.org/statistical-process-control-spc-guide-line
Toggerson & Philbin (n.d). Physics 123 lab manual. UMASS. http://openbooks.library.umass.edu/p132-lab-manual/chapter/the-normal-distribution-and-standard-deviation/
University of Colorado (2022). Plinko probability. PhET. https://phet.colorado.edu/en/simulations/plinko-probability
Subgroup data improves a study because of the The Central Limit Theorem. "The central limit theorem states that if you have a population with mean μ and standard deviation σ and take sufficiently large random samples from the population with replacement , then the distribution of the sample means will be approximately normally distributed." From Boston University School of Public Health, 2016.
the average of all the data
arrange data in order from smallest to largest and find the middle number.
the value that is most common
