
Chapter 10: Is the Process Stable?
A Stable Process
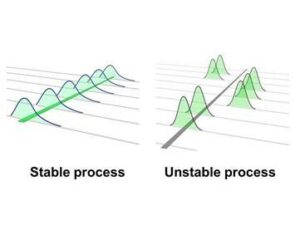
All processes have variation and the products will vary. However, stable processes are only being influenced by common cause variation and this common cause variation is predictable. When a process is influenced by a special cause variation it is not predictable or stable.
In statistical process control, we aim to create a stable process and then monitor the stability so we can easily identify when the special cause variation occurs. Therefore, the first steps is to check for process stability.
AIAG Method for SPC
This content is from the Automotive Industry Action Group which provides education and information to a wide range of people. Their process of using SPC and maintaining control is outline below, but originated from this source: (SPC) Statistical Process Control (AIAG, 2022). Learn more by selecting the link.
There are two phases in SPC control studies:
- Identify and eliminate the special causes of variation in the process. This will stabilize the process and provide control.
- Next, predict future data based on the control data. Once stabilized, the process can be used to determine capability.
Determining Stability

If the process is not stable, the data would not be reliable enough to estimate anything, whether its future performance of capability of a lot of things (Haynes, 2022). In these situations, you will examine the data for non-normal conditions and/or outliers and typically, run the assessment again (van de Merbel et al., 2014).
The tool used to determine stability is a histogram and often run charts. Histograms which are not normal are often an indicator of instability. Additionally, monitoring the histogram over time can prove stability – stable process histogram would be consistent in size and shape over time. Typically a study of more than 100 samples are logged over a long period of time and are utilized to create the histogram and/or run charts. It can be beneficial to monitor the mean, sigma, and also the calculated control limits at the +/-3 sigma values. A stable process has a constant mean and a constant variance/sigma over time. I
If the process is not stable then SPC cannot yet be utilized. Problem-solving to determine and eliminated the special causes of variation must be conducted. Tools such as a fishbone diagram can help identify and brainstorm the possible sources of variation.
Learn more about a common stability analysis method by selecting the following link: Stability Analysis Control Chart
Value of a Histogram
A histogram is a visual representation of data, which the viewer can generally understand easily and interpret the data. Histograms are used when evaluating data that is continuous and counted as separate distinct values (or discrete data). Histograms are valuable to convey information effectively and to show changes implemented within a process (Presentationeze, 2013). Histograms can also identify outliers in a process (Frost, 2019). Learn more about using histograms to understand data with this article.
Test Yourself
Review the each of the hot spots below on the histogram. Then, answer the review questions to test your knowledge.
References
Automotive Industry Action Group (2022). (SPC) Statistical process control. AIAG. Retrieved on August 8, 2022 from https://www.aiag.org/quality/automotive-core-tools/spc
Benchmark 6ix Sigma (2017). Process stability, process capability. Retrieved on August 8, 2022 from https://www.benchmarksixsigma.com/forum/topic/34898-process-stability-process-capability/
Cordaro, C. (2013, September 16). Process stability [Video]. YouTube. https://www.youtube.com/watch?v=tTRJ2vNvr3M
Frost, J. (2019). Using histograms to understand your data. Retrieved on August 8, 2022 from https://statisticsbyjim.com/basics/histograms/
IST/SEMATECH. (2012). e-Handbook of Statistical Methods. Retrieved on August 8, 2022 from http://www.itl.nist.gov/div898/handbook/
ISIXSIGMA (2022). Process stability. https://www.isixsigma.com/dictionary/process-stability/
SPC for Excel (2019, May 1). What do these histograms tell you? The answers [Video]. YouTube. https://www.youtube.com/watch?v=XUeU4tvkXAo
van de Merbel N, Savoie N, Yadav M, Ohtsu Y, White J, Riccio MF, Dong K, de Vries R, & Diancin J. 2014 Feb 19.Stability: recommendation for best practices and harmonization from the Global Bioanalysis Consortium Harmonization Team. AAPS J. 2014 May;16(3):392-9. doi: 10.1208/s12248-014-9573-z. Epub PMID: 24550081; PMCID: PMC4012051.
