
26 Building Sound Arguments Through Quality Evidence
Chapter Objectives
Students will:
- Construct sound arguments.
- Analyze arguments for their strengths and weaknesses.
- Evaluate common types of evidence to assess their quality.
Every day you make and encounter a variety of arguments. You might make an argument to your school’s student government to start an esports club. On a video chat with your parents, you might present an argument for why they should purchase you a car for school or send (more) spending money. Later that night, your friends might seek to convince you that LeBron James, rather than Michael Jordan, is the best basketball player of all time.
 We also routinely encounter arguments about important civic matters. We might read a letter in the newspaper by a school board member arguing why a local property tax increase is necessary to improve area schools. On news programs and in public speeches, we daily hear politicians and political operatives advance arguments about the best way to run the country.
With so many different arguments competing for our adherence, how do we make decisions about personal matters, about what is best for our local community, and about what the nation should do on vital issues of the day?
This chapter enables you to think carefully about logos. Logos is the logical or reasoned basis of an appeal (i.e., argumentation), and it is part of the rhetorical canon of invention (as explained in chapters 1 and 25). By learning more about argumentation, you will improve your ability to make sound decisions and critically analyze public options. You will also learn about speechmaking, since most speeches are based on a series of arguments. In this chapter, we examine two fundamental issues related to reasoning in public speaking: the structure of argument and the selection and evaluation of evidence.
The Structure of Argument
An argument is the advocacy of a belief, attitude, or course of action that is supported by evidence. An argument (or series of arguments) gives reasons why a listener should agree with the perspective being advocated. We begin by considering the development of what is known as the Toulmin model and some limitations to the practice of good reasoning.
Box 26.1 Classical Reasoning

Aristotle advocated the syllogism as the proper form of argument.[1] A syllogism is a three-step proposition that consists of two premises and a conclusion. If the premises are valid, then the conclusion must be true. This is also known as deductive reasoning, reasoning that moves from valid premises to a specific conclusion. The classic example of a syllogism is the following:
All men are mortal. (major premise)
Socrates is a man. (minor premise)
Therefore, Socrates is mortal. (conclusion)
If the two premises can be proven true, then it follows that the conclusion must also be true. This is also the process of formal logic, which relies on the certainty of the offered premises to reach what is considered an unquestioned, or true, conclusion.[2]
Syllogism is a valid argumentative form—as is deductive reasoning generally. However, in regular conversation, we rarely have premises and conclusions that are accepted as absolutely true. Just as often, some premises are omitted from an argument. Observing such tendencies, Aristotle coined the enthymeme as a rhetorical syllogism.
An enthymeme is an informal, incomplete syllogism in which a speaker relies on an audience to use its knowledge and experience to supply missing information that completes the argument. Take, for example, the underdeveloped argument, “Tax incentives for electric vehicles are justified because they will slow climate change.” Its central, unstated premises include “tax incentives influence consumer behavior” and “vehicle emissions contribute to climate change.” The enthymeme expects listeners to supply the missing reasoning that completes the argument.
However, these premises can also be debated or argued. Even if, as an audience member, we can supply a missing premise, we might still reject the argument. In this case, we might reject that “vehicle emissions contribute to climate change” or that the government should intervene in the free market. The contingent nature of premises in enthymemes allows for disagreement on public matters and policy decisions.[3] Exceptions and counterarguments to premises and conclusions result in complex arguments that defy categorization in classical syllogistic form.
The Toulmin Model
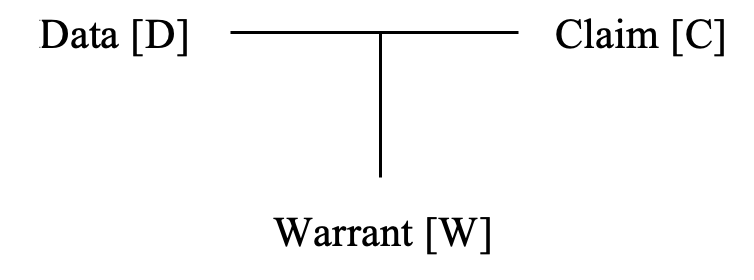
In the 1950s, Stephen Toulmin developed an approach to reasoning that is accepted by many as the standard in argument studies.[4] This approach, popularly known as the Toulmin model, provides a way to understand and critique arguments. In its full form, the model consists of as many as seven parts (see box 26.2); however, we primarily focus on its three most central components: claim, data, and warrant.
Claim
The claim of an argument is what you are attempting to prove and want an audience to accept. Examples of claims include the following:
“I should study chemistry this evening.”
“My education will provide a good return on investment (ROI).”
“My public speaking professor is the best.”
 Your thesis statement is the most important claim in your speech. For instance, in a persuasive speech, you might offer the thesis “Greek organizations’ new member recruitment should be improved.” Each main point—each reason for changing Greek recruitment—is also a claim that supports your thesis. These are what we call subclaims because they are subordinate to the larger argument.
Box 26.2 The Toulmin Model
Born in London, Stephen Toulmin (1922–2009) studied mathematics and physics before turning to philosophy and a focus on ethics, logic, and reasoning after World War II.[5] While Toulmin authored several books and taught at multiple US institutions, he is best known for the model of argument that came to be identified with his name.
In his 1958 book The Uses of Argument, Toulmin originally outlined an argument as consisting of six parts, but following the work of argumentation scholars Richard D. Rieke, Malcolm O. Sillars, and Tarla Rai Peterson, we offer the full model as containing seven elements:
- Claim: The idea one is trying to prove and wants an audience to accept.
- Data: Material or evidence that supports the acceptance of the claim. It answers the question “Why?” or “What have you got to go on?”
- Warrant: A statement that justifies the connection between data and claim. The warrant is often implied and answers the question “How do you get there?”
- Backing: More specific evidence that reinforces data or the warrant. It explains the data or warrant as being “On account of.”
- Qualifier: A term that modifies the strength or certainty of the claim such as “might,” “usually,” or “always.”
- Reservation: A condition or exception when the claim would not be advocated. A reservation is noted by terms like “except” or “unless.”
- Rebuttal: A basis for challenging the validity of the claim.
Data
A claim alone is not an argument. A claim offered without reason, support, or data is merely an assertion, a term previously introduced in chapter 5. An assertion fails to qualify as an argument because no reason is given for why it should be accepted. This is why data, or material and reasons supporting the acceptance of the claim (also commonly called evidence), are essential in forming a valid argument. Note that “data” here refers to all types of evidence, not solely statistics and facts.
 Data fill in the “why” or “because” for your claims. For your thesis that Greek organizations’ new member recruitment should be improved, data could consist of the following:
- statistics on recent challenges to new member recruitment
- testimony about unfair recruitment practices
- examples of problems with the recruitment system
Each piece of information allows you to better support the claim and more convincingly persuade an audience to accept your argument. Data are typically found throughout your speech.
Warrant
 Finally, a valid argument rests upon an acceptable warrant. The warrant provides justification for using the data to support the claim. In essence the warrant is a bridge, often in the form of a value statement, that connects the data with the claim, reinforcing their relationship.
Warrants are typically implied rather than stated; however, at times it is important to state your warrant as well, particularly when an audience may not readily agree with the link between claim and data that you are otherwise asserting.
Consider the following example to understand how a warrant functions:
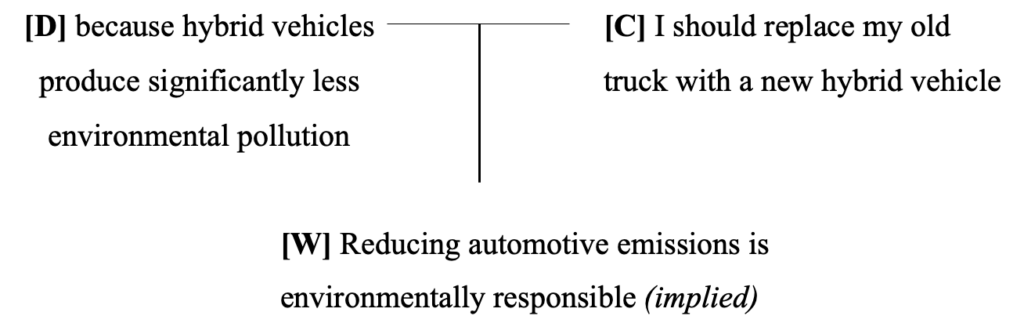
Claim: I should replace my old truck with a new hybrid vehicle
Data: because hybrid vehicles produce significantly less environmental pollution.
The warrant wants to answer how we get from the data to the claim or explain what makes this data a reason to accept the claim.
Warrant: Reducing automotive emissions is environmentally responsible.
It is likely that this warrant would be implied, relying on enthymematic reasons supplied by an audience. Presumably, the positive contribution to the environment is a strong enough incentive to cause the person making this argument to take action. However, there could be counterarguments or rebuttals that might cause this person to reject the claim (the cost of a new vehicle, for example). A more developed argument would consider these possibilities by providing backing for the warrant and/or data in quantifying the environmental benefits.
Box 26.3 Visualizing the Toulmin Model
The Toulmin model provides a layout to visualize or diagram arguments.
Example argument: I should replace my old truck with a new hybrid vehicle because hybrid vehicles produce significantly less environmental pollution.
The Toulmin model is more than a way of diagramming arguments—it is a way of improving how you think about arguments. It allows you to conceptualize and diagnose your own arguments and those produced by others. Putting an argument into the Toulmin form can allow you to
- see what the claim is and if it is reasonable;
- consider what the data are, if there is enough, and the data’s quality; and
- evaluate if there is a reasonable warrant, or one can be inferred, that connects the data and the claim.
Because the model promotes clearer thinking about how we reason together, it is a way of enriching our civic engagement and the messages we send and receive about democratic participation.
Arguments and Their Limits
Rhetorical arguments are powerful but inexact. Audiences can weigh arguments on public issues and come to significantly different conclusions about their merit. Such is the case in the difficult issue of abortion access as different people hold different views on the issue, and different states have vastly different laws.
Some audiences may also refuse to reason. As the example in box 26.4 illustrates, some appeals, urges, and habits overcome reason, and not all decision-makers weigh competing arguments the same way.
Box 26.4 Limitations on Arguments Against Smoking
Think about this abbreviated (and asserted) causal argument: “People should not smoke because scores of scientific studies have proven that smoking has significant adverse health effects, including death.” In a Toulmin form, the argument would appear as follows:
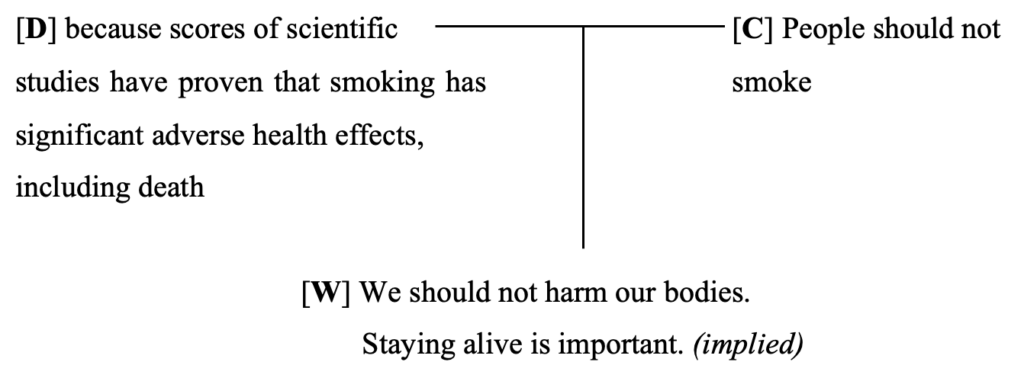
A wealth of valid backing for this argument is available from the Centers for Disease Control and Prevention and other sources. Yet many people who hear the strong evidence against it still smoke. The American Cancer Society reports that as of 2019, approximately thirty-four million people in the United States (14% of the population) smoke.[6] The reasons are no doubt varied, including value hierarchies that justify the decision to smoke, challenges to the evidence concerning the impacts of smoking, and the difficulty of kicking the habit.
Evidence and Its Evaluation
Evidence is data and backing in the form of examples, statistics, and testimony that are used to support a claim. The key is finding not just any evidence but the best evidence to support your argument. When you use weak evidence, your data will generally be insufficient to convince an audience of your argument’s validity.
To discover strong evidence, begin by selecting credible sources using the guidance in chapter 8. Then draw from your sources to find and evaluate evidence. Use the instructions provided next for choosing examples, scrutinizing statistics, and selecting testimony.
Choosing Examples
An example provides a concrete instance in the form of a fact or occurrence. An example seeks to make a claim tangible to an audience. Examples generally take one of three forms: specific, hypothetical, and anecdotes.
Specific Examples
The most valuable type of example is a specific example. A specific example is factual, one that has actually happened or is being experienced. A specific example prompts an audience to recognize that the claim (or a similar claim) has been demonstrated or proven true on a prior occasion.
Box 26.5 Specific Examples in Practice
In a 2023 commencement address at the University of Chicago, Bret Stephens, a New York Times columnist and Chicago graduate, gave a speech that argued for the value of “speaking your mind when other people don’t want you to.” One way he supported his thesis was through the use of a series of specific examples in which conventional wisdom proved incorrect and it would have been beneficial to interrogate the ideas of allies or superiors, including the following:
Why were the economists and governors at the Federal Reserve so confident that interest rates could remain rock bottom for years without running a serious risk of inflation?…Why were so few people on Wall Street betting against the housing market in 2007? Why were so many officials and highly qualified analysts so adamant that Saddam Hussein had weapons of mass destruction?…and why did so many major polling firms fail to predict Donald Trump’s victory in 2016?[7]
The effectiveness of Stephens’s examples was in their succinct expression of a series of specific instances where most experts were ultimately proven incorrect and more dissenting voices would have been valuable.
Hypothetical Examples
A less powerful but still useful type of example is a hypothetical example. A hypothetical example is based on a plausible event or occurrence but does not represent a specific, actual instance. This sort of example allows an audience to visualize the claim, but it lacks the concrete data of a specific example.
Box 26.6 Hypothetical Examples in Practice

In 2023 when former South Carolina governor and US ambassador to the United Nations Nikki Haley announced her intention to run for the 2024 Republican presidential nomination, she spoke of her desire to create a country where “anyone can do anything and achieve their own American dream.” To illustrate her claim, Haley pointed to a plausible range of American experiences, without naming any one individual in particular as possessing the experiences:
The college student who’s paying too much and getting too little from her education. The young adult in his first real job wondering how he’ll ever afford a mortgage or start a family. The single mom working two jobs and three times harder than anyone else.…I’m fighting for all of us because all of us have to be in this together.[8]
Haley used hypothetical examples that allowed her audience to visualize themselves within the America she was seeking to lead.
Anecdotes
Finally, anecdotes, which we defined in chapter 11 as stories or extended examples in narrative form, are more elaborate examples that include additional detail. Often presented in the form of personal narratives, these examples seek a deeper connection with the audience. While powerful, these take time for a speaker to develop and present.
Box 26.7 Anecdotes in Practice
An effective illustration or personal narrative is again found in Nikki Haley’s presidential campaign announcement. Three times in that speech Haley returned to her status as “the proud daughter of Indian immigrants” to illustrate the relevance of her personal experience in leading “a new generation” of Americans “into the future.” The extended example peaked near her conclusion where she underscored her experiences a final time. Speaking about the “country’s renewal,” she shared:
I’m more confident than ever that we can make this vision real in our time because that’s what I’ve seen my entire life. As a brown girl growing up in a black and white world, I saw the promise of America unfold before me. As the proud wife of a combat veteran, I saw our people’s deep love of freedom and our determination to defend it. As governor I saw our state move beyond hate and violence and lift up everyone in peace.…The time has come to renew that spirit and rally our people. Our moment is now.…Let’s save our country…and move forward together.[9]
Here Haley offers an illustration of her life experiences that is richer than any specific accomplishment she has had as a politician and provides insight into her life.
Not all examples are equal, and thus you must carefully evaluate their selection. A poor example fails to justify your claim and risks damaging your credibility and persuasiveness.
Here are a few considerations (also found in box 26.15) that you should make when selecting and evaluating examples:
- Is the example representative, or typical, of the broader situation or experience?
- Are a sufficient number of examples used to prove the claim?
- Have negative examples (counterexamples) been addressed?
- Is the example compelling in its detail, clarity, and vividness?
Consider these questions when evaluating the strength of an example, though an example may not meet all of these standards and still be satisfactory.
Box 26.8 Examples as Evidence
An example provides a concrete instance in the form of a fact or occurrence. It seeks to make a claim tangible to an audience. Examples generally take one of three forms.
- Specific example: A specific example is factual, an example that has actually happened or is being experienced.
- Hypothetical example: A hypothetical example is based on a plausible event or occurrence but does not represent a specific, actual instance.
- Anecdote: Anecdotes, extended examples, or illustrations are more elaborate examples that contain additional detail.
Scrutinizing Statistics
Statistics, a second common form of evidence, represent information in numeric form according to size, quantity, or frequency. In public speaking, statistics are most commonly used to demonstrate public opinion, capture common experiences and behaviors, and efficiently express the distribution and allocation of resources.
Speakers love statistics—and with a little searching, it seems we can find a statistic for just about anything, from the number of pieces of mail processed and delivered every day by the US Postal Service (318 million) to the percentage of people who believe in extraterrestrials (about 65% of adults in the United States).[10]
Because statistics have an air of tangibility, appear to be exact, and seem authoritative, we too often accept them as true. In reality, statistics should be carefully scrutinized. As American author and satirist Mark Twain is purported to have once said, “There are lies, damned lies, and statistics.” Nonetheless, statistics are a useful basis of proof in many speeches.
Box 26.9 Statistics in Practice

In his April 3, 2024, remarks at the Stanford Graduate School of Business, Federal Reserve Board Chairman Jerome H. Powell relied on statistics in advancing his case that the nation’s economic outlook was continuing to improve after a period of stubbornly high inflation. Powell supported his contention by pointing to improvements in inflationary trends and continued job growth.
- Specifically, Powell noted that inflation had slowed from an annual rate of 5.2% in the prior year to only 2.5% in the twelve-month period leading to February 2024.
- Moreover, three million new jobs had been created in 2023 as inflation declined, and an average of 265,000 new jobs were added in the previous three months.
- Due to such changes, the Federal Open Market Committee predicted continual, if “sometimes bumpy,” progress toward the Fed’s goal of 2% annual inflation.
These statistics, which reflect the use of raw numbers, trends, and averages, were some of the primary data offered by Powell as he addressed the overall health of the US economy.[11]
Four of the most common forms of statistics called upon by public speakers are averages, raw numbers, trends, and polls.
Average
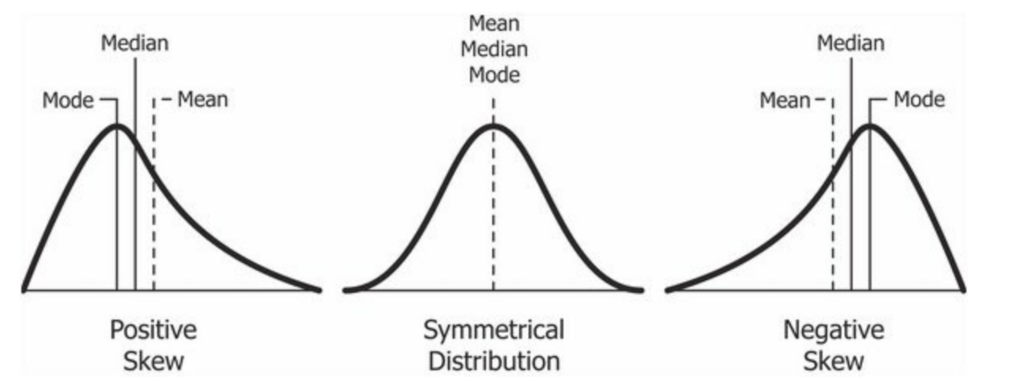
An average is a common and seemingly benign statistic that is frequently used by speakers. In principle it represents what is typical—what is average—and in box 26.9, we see Federal Reserve Board Chair Powell making use of the average number of new jobs being added to the economy on a monthly basis—265,000. However, an average may be more complicated than it initially appears because there are at least three methods for determining an average—through mean, median, or mode.
The most common method for representing an average is the mean. A mean is derived by summing all the data and dividing the total by the number of data points. The median, in contrast, is the data point that appears in the exact middle of a sample, and the mode is the result number that appears most frequently.
Box 26.10 Limitations of Using the Mean to Find an Average
Suppose you were leading a discussion about the low working wages available for college students seeking summer employment. A statistic you might find valuable is the amount earned by the average student worker in your class during the previous summer (this would be a small sample but a relevant one to your audience).
If you had access to all the financial data, you could determine the mean income by adding together the total dollars earned by your classmates and then dividing it by the number of student workers. If twenty-five students had combined wages of $150,000, the mean student income was $6,000. Seems clear enough, right?
However, what if you found that this included $50,000 earned by a single student in an astoundingly successful entrepreneurial venture? How does this change the average, and what does it do to the value, meaning, and accuracy of this statistic for your speech?
Raw Number
A second common statistic is a raw number. In the student wages example in box 26.10, the raw number was $150,000 (the total wages earned). In box 26.9, Jerome Powell made use of a raw number as well—three million jobs added in the previous year. We use raw numbers when we want to draw on the power of the magnitude of a number. An average may make a number seem small or insignificant, but by giving the entire scope of the data through a raw number, an audience may gain a better grasp of the situation.
However, the opposite may also be true: A raw number can make a problem look much worse than it actually is because it combines all the data into a single representation. Box 26.11 provides an example.
Box 26.11 Limitations of Using Only Raw Numbers

If you were to learn that the Biden administration proposed a $34 billion increase (a raw number) to the United States’ 2025 defense budget, you might be concerned about the seemingly large budget increase. However, if you also were provided with a trend statistic clarifying this represented a budget increase of only about 4.1%—and that after accounting for inflation over the prior two years the spending power of the defense budget experienced a 3% decline—you might perceive the raw number differently.[12]
Trend Statistic
When a speaker wants to demonstrate a change that has occurred over a period of time, the statistic that is most often used is called a trend. A trend statistic emphasizes change in a clear and meaningful way by providing two points of comparison. As the Powell example in box 26.9 demonstrates, trend statistics are important to economists. Trend statistics for inflation, gross domestic product, unemployment, and interest rates can provide a more focused and efficient evaluation of the immediate economic climate.
Polling Data

Finally, perhaps the most popular type of statistic is polling data. A valid, scientific poll measures the opinions or beliefs of a large group of people by collecting data from a representative random sample that is similar in its demographics to the rest of the population and then generalizes the results.
Polling data is collected on a variety of topics, ranging from whom one intends to vote for in a presidential election to what is the best movie ever made. One of the oldest and most recognized polling researchers is Gallup, a global analytics firm that has measured public opinion for nearly a century. Gallup regularly tracks opinions on various topics, such as consumer confidence, presidential approval, and the future of Medicare and Social Security. While polling data must be carefully analyzed, it is valuable in giving your audience an indication of what a larger public thinks. That is, while the majority may not always be right, their opinion can be influential.
However, not all polls are equally valid, and in selecting polling data, there are several items you should consider:
- In particular, you should verify that the poll is based on a representative random sample. This can be determined by examining how the poll was conducted—who was polled, how they were polled, how many people were polled, when they were polled—and what the margin of error is. The margin of error is the uncertainty or potential variation in a polling result. It reflects the sampling error or margin in which there is less confidence about the accuracy of the survey result.
- Also, be careful how you use nonscientific internet polling that asks website visitors their opinion on an issue. Such polls have a selection bias in terms of who chooses to take the poll. For example, The Athletic’s daily sports newsletter, “The Pulse,” periodically gives sports fans the opportunity to express their opinion on various sports-related issues and events. Such polls are interesting to sports fans and do show something of popular opinion, but be mindful that the results are not statistically valid.
Box 26.12 The American Freshman
The Cooperative Institutional Research Program (CIRP) Freshman Survey, administered by the Higher Education Research Institute at UCLA, is taken by tens of thousands of first-time full-time college students each fall. In 2019, 126,642 new students from 178 four-year schools participated in the survey. Ninety-five thousand of those students from 148 institutions were included in the normative data that was reported. Among the results are the following:[13]
- Getting a better job was identified as a “very important” reason to attend college by 83.5% of respondents.
- Making more money was named as a “very important” reason to attend college by 73.2% of respondents.
- A personal goal of being well-off financially was indicated by 84.3% of respondents.
- A significant portion of respondents, specifically 43.6%, perceived themselves as “middle-of-the-road” politically.
|
Issue |
2019 Respondents Indicating Agree Strongly or Agree Somewhat |
2015 Respondents Indicating Agree Strongly or Agree Somewhat |
2012 Respondents Indicating Agree Strongly or Agree Somewhat |
|
Abortion should be legal. |
73.1% |
63.6% |
61.1% |
|
Students from disadvantaged social backgrounds should be given preferential treatment in college admissions. |
X |
52.3% |
41.9% |
|
Racial discrimination is no longer a major problem in America. |
X |
18.6% |
23% |
|
Same-sex couples should have the right to legal marital status. |
X |
81.1% |
75% |
|
Colleges have the right to ban extreme speakers from campus. |
51% |
43.2% |
X |
- What other information would you want to know about the data before deciding whether to use it?
- How useful might this information be to a speaker planning a presentation on a related topic?
- How might the information be misused or overgeneralized?
- What information do these results leave out?
In sum, it is crucial that you carefully scrutinize statistics. You should closely consider how a statistic was derived so you have a good grasp of its validity. It is ethically suspect to simply report a number without some understanding of how it was derived. Similarly, as a listener, be skeptical of statistics presented without enough information or context to evaluate their credibility. A statistical conclusion is only as good as the method used to arrive at it. For that reason, here are a few questions (also in box 26.15) you should ask when selecting and evaluating statistics:
- If the number is an average, is it the mean, the median, or the mode? Is it representative of the data, or is it skewed by an extreme data point?
- What was the sample size: the number of people used to determine the average or polled?
- If using polling data, what is the margin of error or reliability? Polls that have a margin of error greater than a few percentage points are suspect, particularly if the margin of error is greater than the difference between the polling result options.
- What do you know about the sample? Was it randomly selected? Are there factors about the sample population (age, gender, geography, etc.) that make the data suspect?
- When was the data collected? Public opinion, averages, and raw numbers can change with time.
Box 26.13 Statistics as Evidence
A statistic represents information in numeric form according to size, quantity, or frequency. A statistic has an aura of certainty and exactness while being able to efficiently express public opinion, capture common experiences, or show the scope of an issue. Statistics may be expressed in several forms.
- Raw number: A single number or figure that captures the breadth of an occurrence.
- Trend statistic: A trend statistic represents meaning over a specific period of time.
- Polling data: Polling data seeks to represent the opinions or beliefs of a large group of people by collecting data from a representative random sample.
- Average: An average seeks to numerically represent what is a typical or common experience. An average may be derived in three different ways.
- The mean is calculated by adding together all the data and dividing the sum by the total number of data points. Within the mean might be outliers—experiences that are either much larger or much smaller than what is typical.
- The median seeks to compensate for outliers by representing the data point that is in the exact middle of the sample; it is the middle result from among all of the data points.
- The mode is the data point that appears most frequently in the sample.
Selecting Testimony
Testimony is a third common form of evidence that serves as data and backing for arguments. Testimony is facts or opinions drawn from the words, experiences, and expertise of another individual. Testimony is used to supplement our own opinions and experiences.
Testimony should come from authoritative sources on an issue. In chapter 8, we recognized three types of source authorities. Subject authorities are sources with trained expertise on the topic. Societal authority emphasizes a source’s power to control outcomes based on their position within a society or organization. Authority can also be accrued through special experiences.
Suppose you are giving a speech on US immigration from Venezuela. You may have sensible ideas, but your audience is unlikely to accept your opinions alone. Instead, you should build your credibility by supplying well-informed testimony as data for your claims. Perhaps you could draw on testimony from the following:
- subject authorities such as Dr. Christopher Salas-Wright, whose research focuses on Latin American migrants
- societal authorities such as the Migration Policy Institute, a nonpartisan nonprofit organization
- authorities from special circumstances like a Venezuelan who immigrated to the United States
Testimony from such figures about the wisdom of your proposal would significantly aid the power of your argument.
Effective testimony provides explanation and analysis. Make clear how and why the source is authoritative on the issue. Then offer a sufficient amount of testimony to make the evidence compelling. For example, saying that an economic analyst declared “The current economic recovery will not continue” does not say much. The testimony fails to provide an explanation or analysis for why this perspective is justified.
Box 26.14 Testimony in Practice
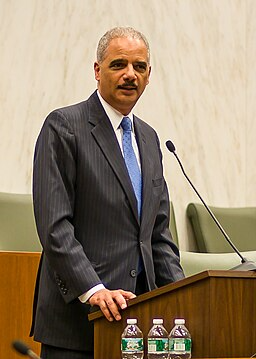
In a 2011 speech on voter registration and rights, then–Attorney General Eric Holder used testimony to support his contention that voting rights are important and in need of attention.
Near the start of his address, Holder quoted former President Lyndon B. Johnson as saying, “The right to vote is the basic right, without which all others are meaningless.” Holder drew from Johnson’s authority as the president who in 1965 signed the Voting Rights Act into law.
In turn, to establish that there was a threat to this essential right, Holder drew from US Congressman John Lewis, a civil rights leader from the 1960s with firsthand knowledge and experience of the struggles over voter registration and voting rights. Holder quoted Lewis to supply testimony that voting rights are “under attack…[by] a deliberate and systematic attempt to prevent millions of elderly voters, young voters, students, [and] minority and low-income voters from exercising their constitutional right to engage in the democratic pro[cess].”[14]
In this way Attorney General Holder, himself a credible source based on his title and position, enhanced his argument through the use of testimony.
As with the other forms of evidence, there are some considerations to make (also in box 26.15) when selecting and evaluating testimony:
- Is the source a qualified authority due to their subject expertise, societal position, or special circumstances? The testimony will strengthen your speech only if the source can truly add insight based on their status as a qualified authority on the topic being addressed.
- Does the source have firsthand knowledge of the issue? Ideally, the testimony is based on experience rather than opinion, and the source has had close dealings with the issues you are addressing.
- Does the source have excessive personal interest in the issue? A conflict of interest might overly bias the source’s testimony.
- What assumptions are made in the testimony? Consider what the source assumed when they made the comments and consider whether those assumptions are consistent with your own assumptions and argument.
Examples, statistics, and testimony are necessary components of valid arguments as they provide the substance used to demonstrate claims. Effective speakers use all three types of evidence in their presentations. Box 26.15 summarizes useful guidelines for selecting and evaluating examples, statistics, and testimony as you build and listen to speeches and arguments.
Box 26.15 Guidelines for Selecting and Evaluating Evidence
|
Universal Criteria |
Using Examples |
Using Statistics |
Using Testimony |
|
|
|
|
Summary
Arguments form the basis of decisions we make daily; thus, the ability to produce high-quality arguments is of vital concern to public speaking and civic participation. In this chapter you have learned the fundamental elements of argument and how to support them.
- An argument is the advocacy of a belief, attitude, or course of action that is supported by evidence. An argument (or series of arguments) gives listeners reasons for adopting or agreeing with the perspective advocated.
- The Toulmin model of argument is a seven-part model that provides a way to conceptualize, verify, and critique arguments so that one can more effectively understand and evaluate public arguments.
- The central elements of the Toulmin model are claim, data, and warrant. The claim of an argument is what the speaker seeks to prove and wants an audience to accept. Data are material and reasons that support the acceptance of the claim. The warrant provides the justification for using the data to support the claim, acting as a bridge between the two concepts.
- Evidence is data and backing in the form of examples, statistics, and testimony that is used to support a claim. Evidence is vital in providing support, and without evidence or data, a speaker is left only with assertion.
- An example is evidence that supports a claim by providing a concrete instance in the form of a fact or occurrence. The principal forms of examples are specific examples, hypothetical examples, and anecdotes. When selecting and evaluating examples, speakers should judge if the example is representative, if a sufficient number of examples have been provided to prove the argument, if negative examples have been accounted for, and if the examples have been expressed with sufficient detail and clarity.
- Statistics represent information in numeric form according to the size, quantity, or frequency of an idea, outcome, or occurrence. Four common forms of statistics are averages, raw numbers, trends, and polls. When selecting and evaluating statistics, pay attention to how an average was derived, observe the selection and size of a sample population, review margin of error or reliability for polling data, and consider the source and date of the statistics.
- Testimony is facts or opinions derived from the words, experiences, and expertise of another individual. When selecting and evaluating testimony, speakers should use a qualified authority with clear expertise, firsthand knowledge of the topic, and a minimum of personal interest or bias. It is also important to understand the assumptions of testimony in order to be confident it is utilized in a fair and accurate manner.
Key Terms
argument
average
claim
data
deductive reasoning
enthymeme
evidence
example
hypothetical example
margin of error
mean
median
mode
polling data
raw number
sample size
specific example
statistics
syllogism
testimony
Toulmin model
trend statistic
warrant
Review Questions
- What is an argument?
- What are the primary parts of an argument according to the Toulmin model? What function does each element of argument serve?
- What are the primary forms of evidence? What tests should you perform in evaluating the quality of each type?
Discussion Questions
- What is required to make a “good” or “quality” argument? Why do people sometimes reject “good” arguments?
- What is the value of the Toulmin model?
- Test your ability to identify arguments by analyzing an editorial from The Wall Street Journal or The New York Times. First identify the thesis, the subclaims, the data, and the warrants. Second, identify what types of data (i.e., examples, statistics, testimony) are used. Third, assess the quality of the data to create an overall assessment of the editorial—is it a good argument?
- As you watch television or read a magazine, think about the advertisements. Are the advertisements arguments? Do some of them present a claim and data? How do they compare with the arguments you find in speeches and essays?
- Aristotle, Rhetoric (ed. J. H. Freese, 1926), Perseus Digital Library, https://www.perseus.tufts.edu/hopper/text?doc=Perseus:text:1999.01.0060. ↵
- Stephen Toulmin, The Uses of Argument (Cambridge: Cambridge University Press, 1958), 122. ↵
- John T. Gage, “Enthymeme,” in Encyclopedia of Rhetoric and Composition: Communication from Ancient Times to the Information Age, ed. Theresa Enos (New York: Garland, 1996), 223–25. ↵
- Toulmin, Uses of Argument. ↵
- William Grimes, “Stephen Toulmin, a Philosopher and Educator, Dies at 87,” New York Times, December 11, 2009, https://www.nytimes.com/2009/12/11/education/11toulmin.html; Toulmin, Uses of Argument, in particular chapter 3, “The Layout of Argument,” 94–145; Richard D. Rieke, Malcolm O. Sillars, and Tarla Rai Peterson, Argumentation and Critical Decision Making, 7th ed. (New York: Pearson, 2009), 91–97. We rely on Rieke, Sillars, and Peterson’s explanation of the Toulmin model because it seems to best align with Toulmin’s later views. See Gary A. Olson, “Literary Theory, Philosophy of Science, and Persuasive Discourse: Thoughts from a Neo-Premodernist,” Journal of Advanced Composition 13, no. 2 (1993): 291, https://www.jstor.org/stable/20865918. ↵
- Sandy McDowell, “Smoking Rates Historically Low, but Other Cancer-Related Behaviors Need Improvement,” American Cancer Society, May 19, 2021, https://www.cancer.org/research/acs-research-news/acs-report-smoking-rates-historically-low-but-other-cancer-related-behaviors-need-improvement.html, archived at https://perma.cc/MKN4-PM63. ↵
- Bret Stephens, “Go Forth and Argue,” New York Times, June 2, 2023, https://www.nytimes.com/2023/06/02/opinion/free-speech-campus.html. ↵
- “Watch Nikki Haley’s Full Speech Announcing Presidential Run,” video, NBC News, February 15, 2023, 20:50, https://www.nbcnews.com/video/watch-nikki-haley-s-full-speech-announcing-presidential-run-163418181896. ↵
- “Watch Nikki Haley’s Full Speech Announcing Presidential Run,” 23:30. ↵
- “Postal Facts: One Day in the Postal Service,” United States Postal Service, https://facts.usps.com/one-day/, archived at https://perma.cc/Y3X4-CKY7, accessed March 11, 2025; Courtney Kennedy and Arnold Lau, “Most Americans Believe in Intelligent Life Beyond Earth; Few See UFOs as a Major National Security Threat,” Pew Research Center, June 30, 2021, https://www.pewresearch.org/short-reads/2021/06/30/most-americans-believe-in-intelligent-life-beyond-earth-few-see-ufos-as-a-major-national-security-threat/, archived at https://perma.cc/PU2V-PERC. ↵
- Jerome H. Powell, “Fireside Chat at the Stanford Business, Government, and Society Forum,” Board of Governors of the Federal Reserve System, April 3, 2024, https://www.federalreserve.gov/newsevents/speech/powell20240403a.htm, archived at https://perma.cc/NM3G-VGTW. ↵
- Michael E. O’Hanlon and Alejandra Rocha, “What’s in Biden’s $850-Billion Defense Budget Proposal?,” Brookings Institution, March 15, 2024, https://www.brookings.edu/articles/whats-in-bidens-850-billion-defense-budget-proposal/, archived at https://perma.cc/UH3P-8P92. ↵
- “The American Freshman: National Norms Fall 2019,” Higher Education Research Institute, https://www.heri.ucla.edu/monographs/TheAmericanFreshman2019.pdf; “The American Freshman: National Norms Fall 2015,” Higher Education Research Institute, https://www.heri.ucla.edu/monographs/TheAmericanFreshman2015-Expanded.pdf; “The American Freshman: National Norms Fall 2012,” Higher Education Research Institute, https://www.heri.ucla.edu/monographs/TheAmericanFreshman2012.pdf. ↵
- All quotes from Eric Holder, “Attorney General Eric Holder Speaks at the Lyndon Baines Johnson Library & Museum" (transcript, Austin, TX, December 13, 2011), U.S. Department of Justice Archives, https://www.justice.gov/archives/opa/speech/attorney-general-eric-holder-speaks-lyndon-baines-johnson-library-museum, archived at https://perma.cc/J5AQ-2X5J. ↵
