10 Vascular Sonography
10.1 Learning Objectives
After reviewing this chapter, you should be able to do the following:
- View and identify the anatomical structures of the venous systems and the corresponding ultrasound images.
- Explore the arterial system and the corresponding ultrasound images.
10.2 Introduction
The topics covered in this section will include some of the ultrasound basics of the venous and arterial systems, including transcranial, carotid, aorta, and lower-extremity ultrasound imaging.
10.3 The Venous System
The primary physiologic functions of the venous system are to return the deoxygenated blood to the heart, thermoregulate, store blood (at any instance, the venous system contains up to 70% of the circulating blood), and regulate the cardiac output. It is divided into three systems: superficial, perforating, and deep veins. Figure 10-1 shows the anatomy of the venous system. Blood flows from the superficial to deep veins through branching perforating veins. The deep veins usually follow the arteries in the same areas and often have similar names. For example, the femoral vein is beside the femoral artery. The deep venous system eventually returns blood to the right side of the heart. Since the venous system is usually a low-pressure system, veins have bicuspid valves to allow flow in one direction from superficial to deep (the foot is the exception) and from distal to proximal. Muscular contraction helps with venous flow, such as in the calf muscle pump in the leg.[1]
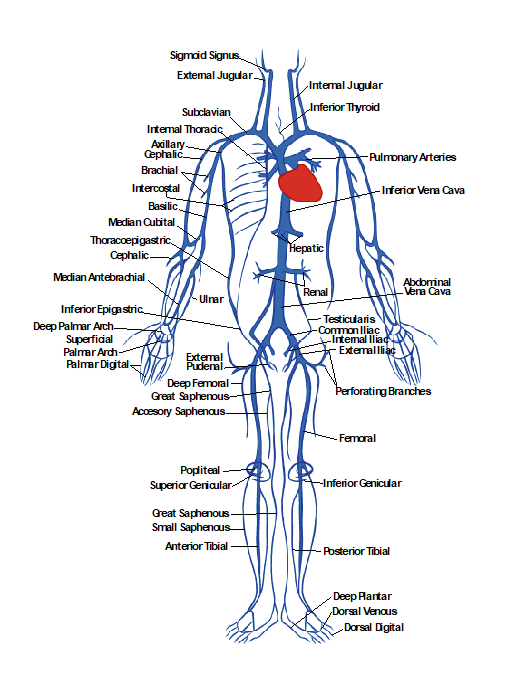

Venous pathophysiology has many etiologies, such as trauma and genetic predisposition, and can occur when outflow is impaired by dysfunctional valves, resulting in retrograde flow and causing a condition known as chronic venous insufficiency. Vein thrombosis is another condition with many hereditary and acquired etiologies, such as trauma or prolonged immobilization. Deep vein thrombosis is especially important to evaluate and treat.[2]
The great saphenous vein (GSV) is the longest vein in the human body, as shown in Figure 10-2. It originates in the medial aspect of the foot as part of the dorsal arch. It continues proximally along the medial aspect of the foot and passes anterior to the medial malleolus on the tibia. It ascends along the medial aspect of the leg between the superficial and deep fascia. It typically has 10–20 valves and terminates at the saphenofemoral junction (SFJ). Once flow enters the femoral vein, it is in the deep venous system. Venous anatomy can vary from individual to individual. However, the GSV typically has branching superficial veins, such as the anterior and posterior accessory saphenous veins in the thigh.[3]
The small saphenous vein (SSV) is the second most significant superficial vein that joins the dorsal venous arch in the lateral aspect of the foot. It ascends proximally behind the lateral malleolus and terminates into the deep popliteal vein, although this is highly variable and can extend into the thigh. The SSV typically has 9–12 valves. Like the GSV, the SSV lies between the superficial and deep fascia and can have many branching superficial veins. Perforating veins connect superficial to deep veins. They usually contain a bicuspid valve.[4]
The deep venous system includes the common femoral vein, profunda femoral vein, deep femoral vein, popliteal vein, gastrocnemius veins, soleus veins, anterior tibial veins, posterior tibial veins, and peroneal veins. The direction of venous flow is described as antegrade, retrograde, or absent. In both the deep and superficial venous systems, it is essential to check for the following characteristics: compressibility, spontaneous flow, respiratory variation, augmentation, intraluminal defects, and venous reflux.
Compressibility evaluates if the vein collapses by applying downward pressure with the transducer. Typically, it should compress, since it is a low-pressure vessel. A thrombus can occlude the lumen and prevent compression. Spontaneous flow is observed when the blood flow moves actively without external influences, such as an augmentation maneuver. Respiratory variation, also known as phasicity, refers to regular venous flow changes that occur secondary to intrathoracic pressure during breathing cycles. Augmentation is a maneuver that is used to evaluate possible abnormal flow patterns. For example, by squeezing a distal portion in the calf, an increase in venous flow should be observed just proximal to this area. Absent or diminished flow could suggest obstruction, such as in a thrombus formation, and reversal of flow could indicate incompetent venous valves, such as in venous reflux disease.
Intraluminal defects usually describe a thrombus formation within the lumen of the vein. It is crucial to describe the details of the thrombus formation and whether it is obstructive.
Finally, venous reflux describes blood flow going in the wrong direction, usually from incompetent valves. Maneuvers are usually done to augment blood flow to test for reflux, which is significant if it exceeds 0.5 seconds in the superficial venous system, 0.35 seconds in perforators, and 1 second in the deep venous system.
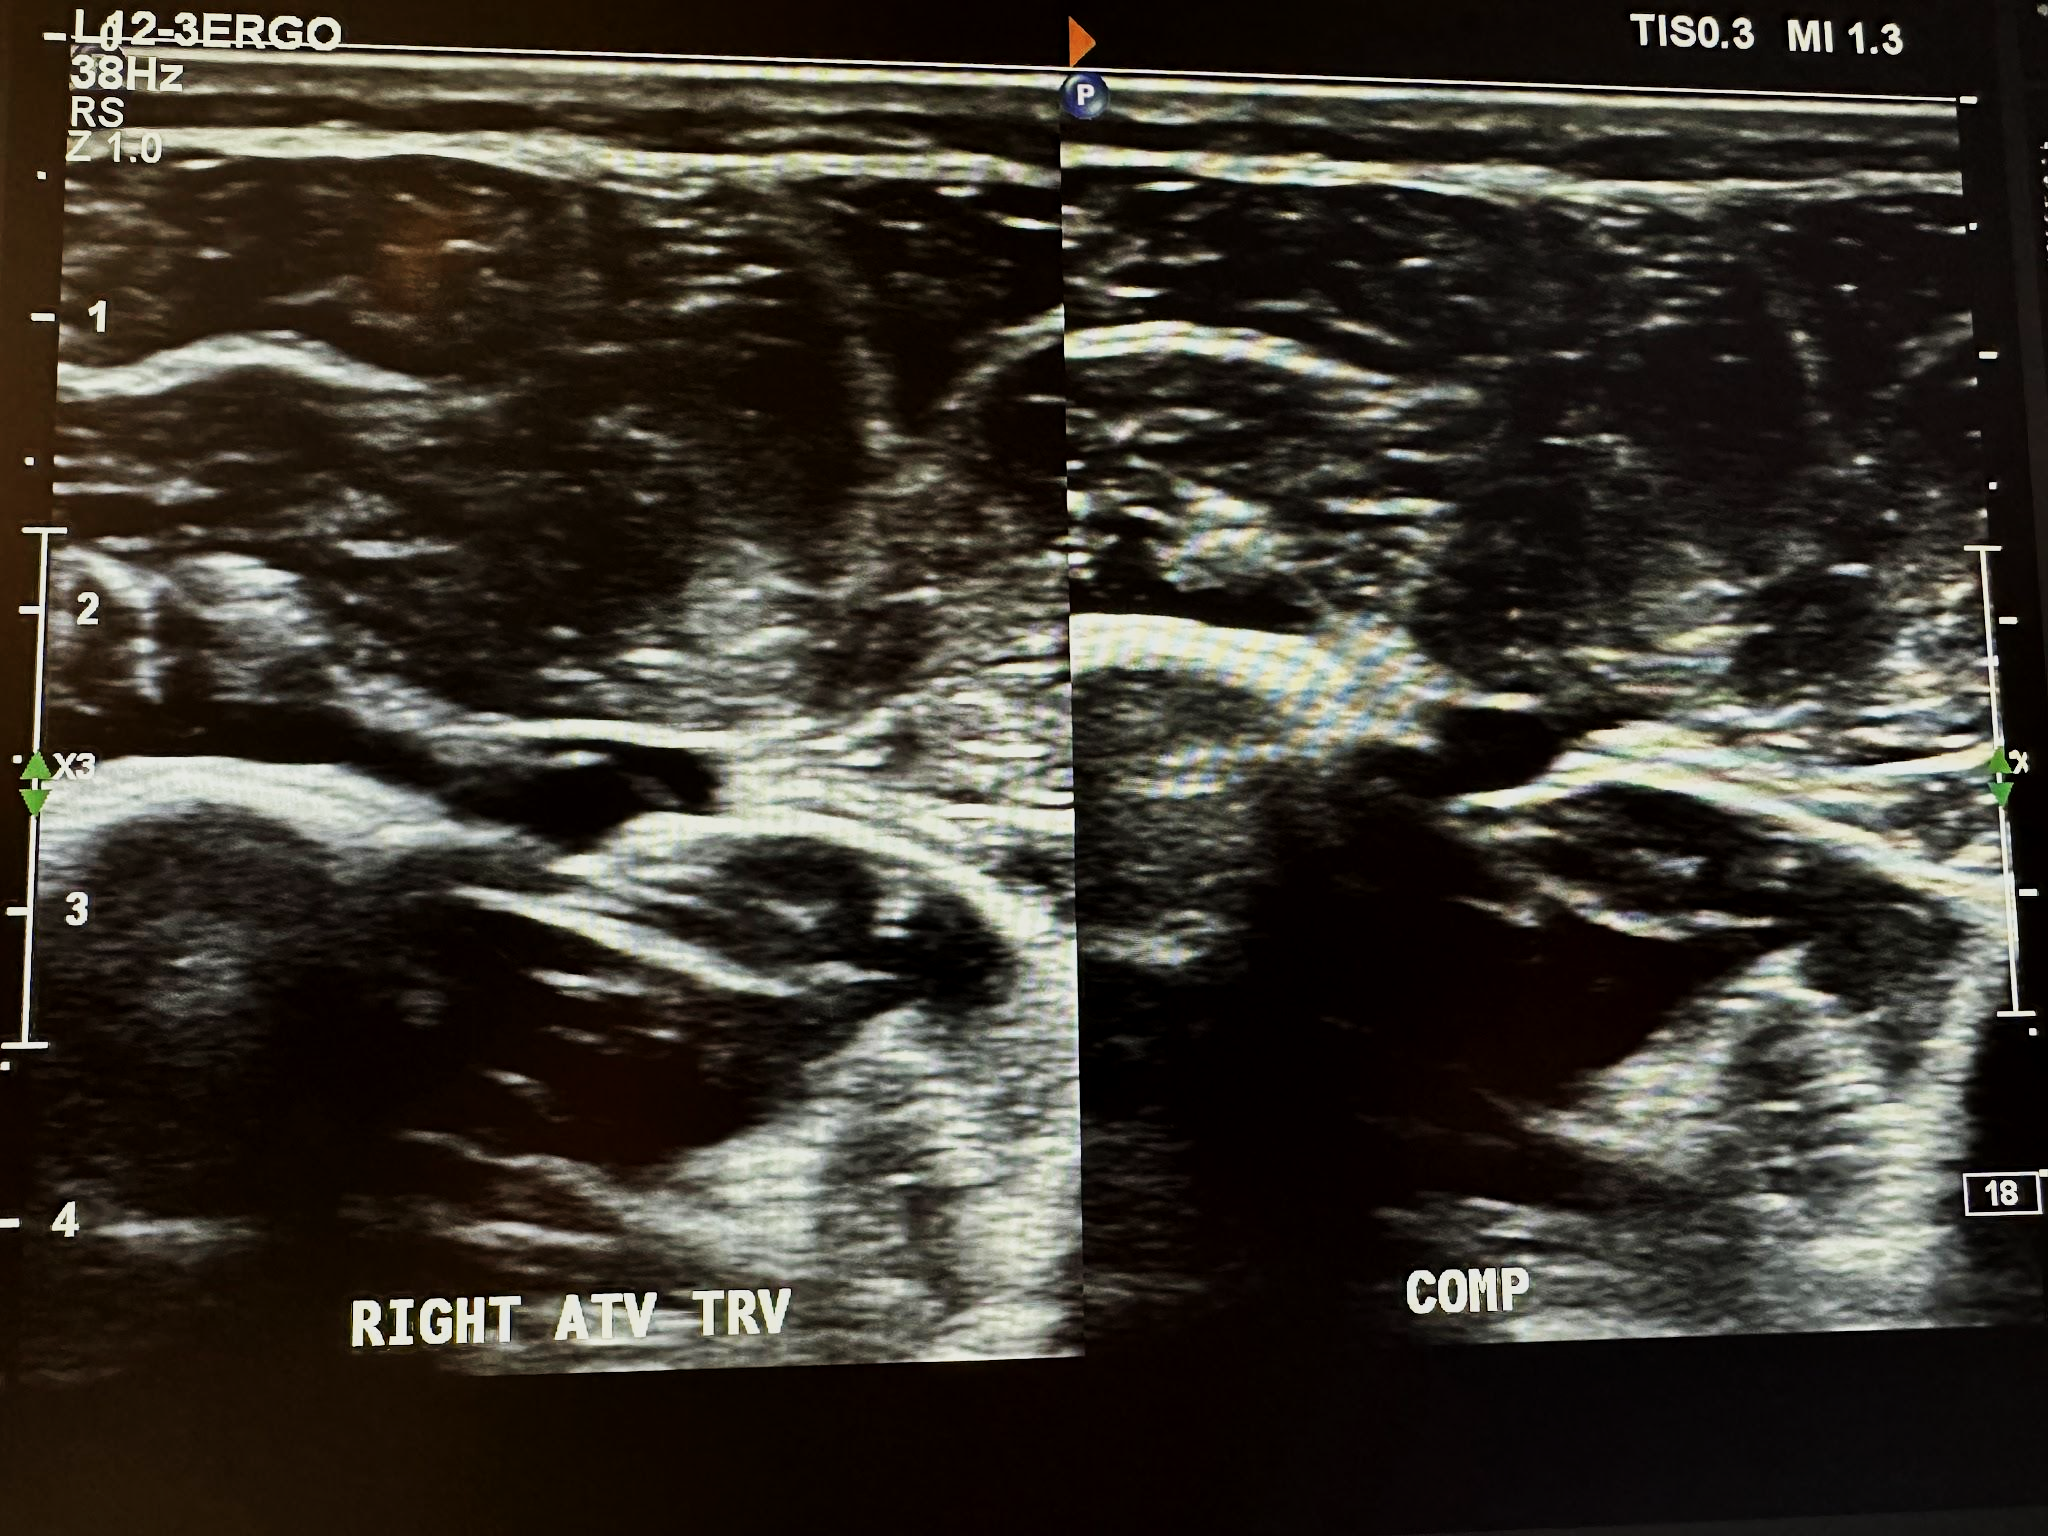
A complete venous duplex ultrasound of the lower extremities starts with a proximal to distal evaluation of the deep venous system in a transverse (TRV) side-by-side image without compression and with compression (COMP). This is followed by a sagittal (SAG) view with augmentation (AUG) using the color Doppler. The veins that are evaluated in succession include the common femoral vein (CFV), profunda femoral vein (PROF V), femoral vein (FV), popliteal vein (POP V), gastrocnemius vein (GASTROC V), posterior tibial vein (PTV), peroneal vein (PERO V), anterior tibial vein (ATV), great saphenous vein (GSV), and small saphenous vein (SSV). The abbreviations given in parentheses in the last few sentences have been labeled in some of the following ultrasound images for venous system discussion. Figure 10-3 shows a side-by-side transverse ultrasound view of the right common femoral vein without compression and with compression, while Figure 10-4 represents the sagittal view of the right common femoral vein with augmentation.
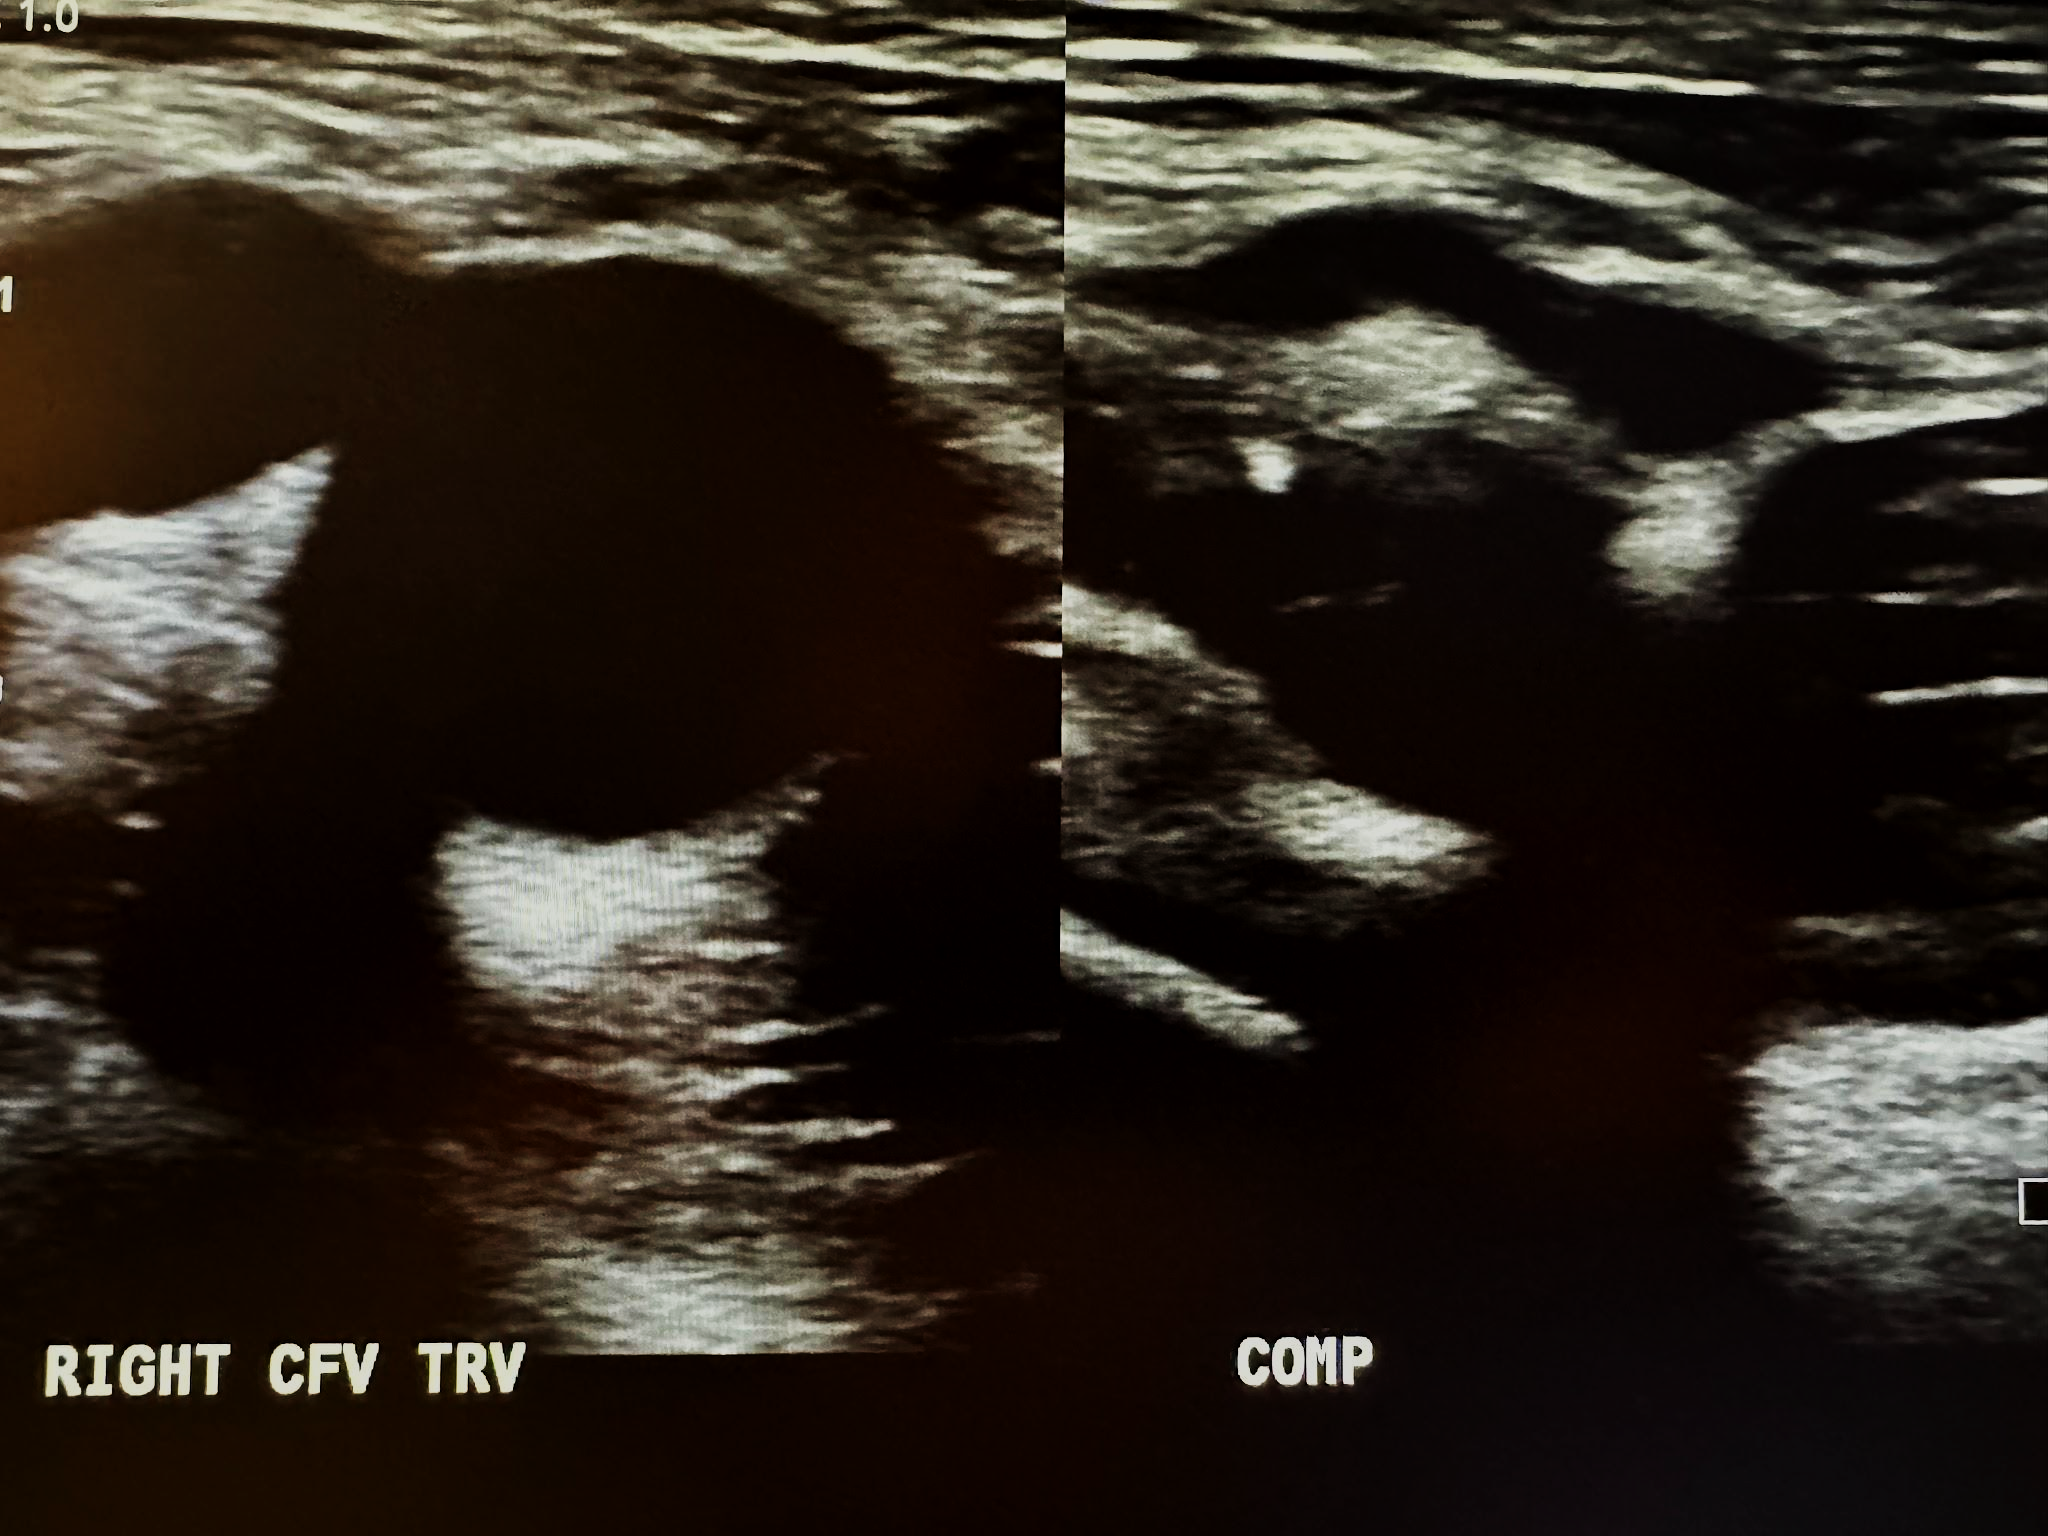

Figure 10-5 shows a side-by-side transverse ultrasound view of the right profunda femoral vein without compression and with compression, while Figure 10-6 represents the sagittal view of the right profunda femoral vein with augmentation.


Figure 10-7 shows a side-by-side transverse ultrasound view of the right femoral vein without compression and with compression, while Figure 10-8 represents the sagittal view of the right femoral vein with augmentation.


Figure 10-9 shows a side-by-side transverse ultrasound view of the right popliteal vein without compression and with compression, while Figure 10-10 represents the sagittal view of the right popliteal vein with augmentation.
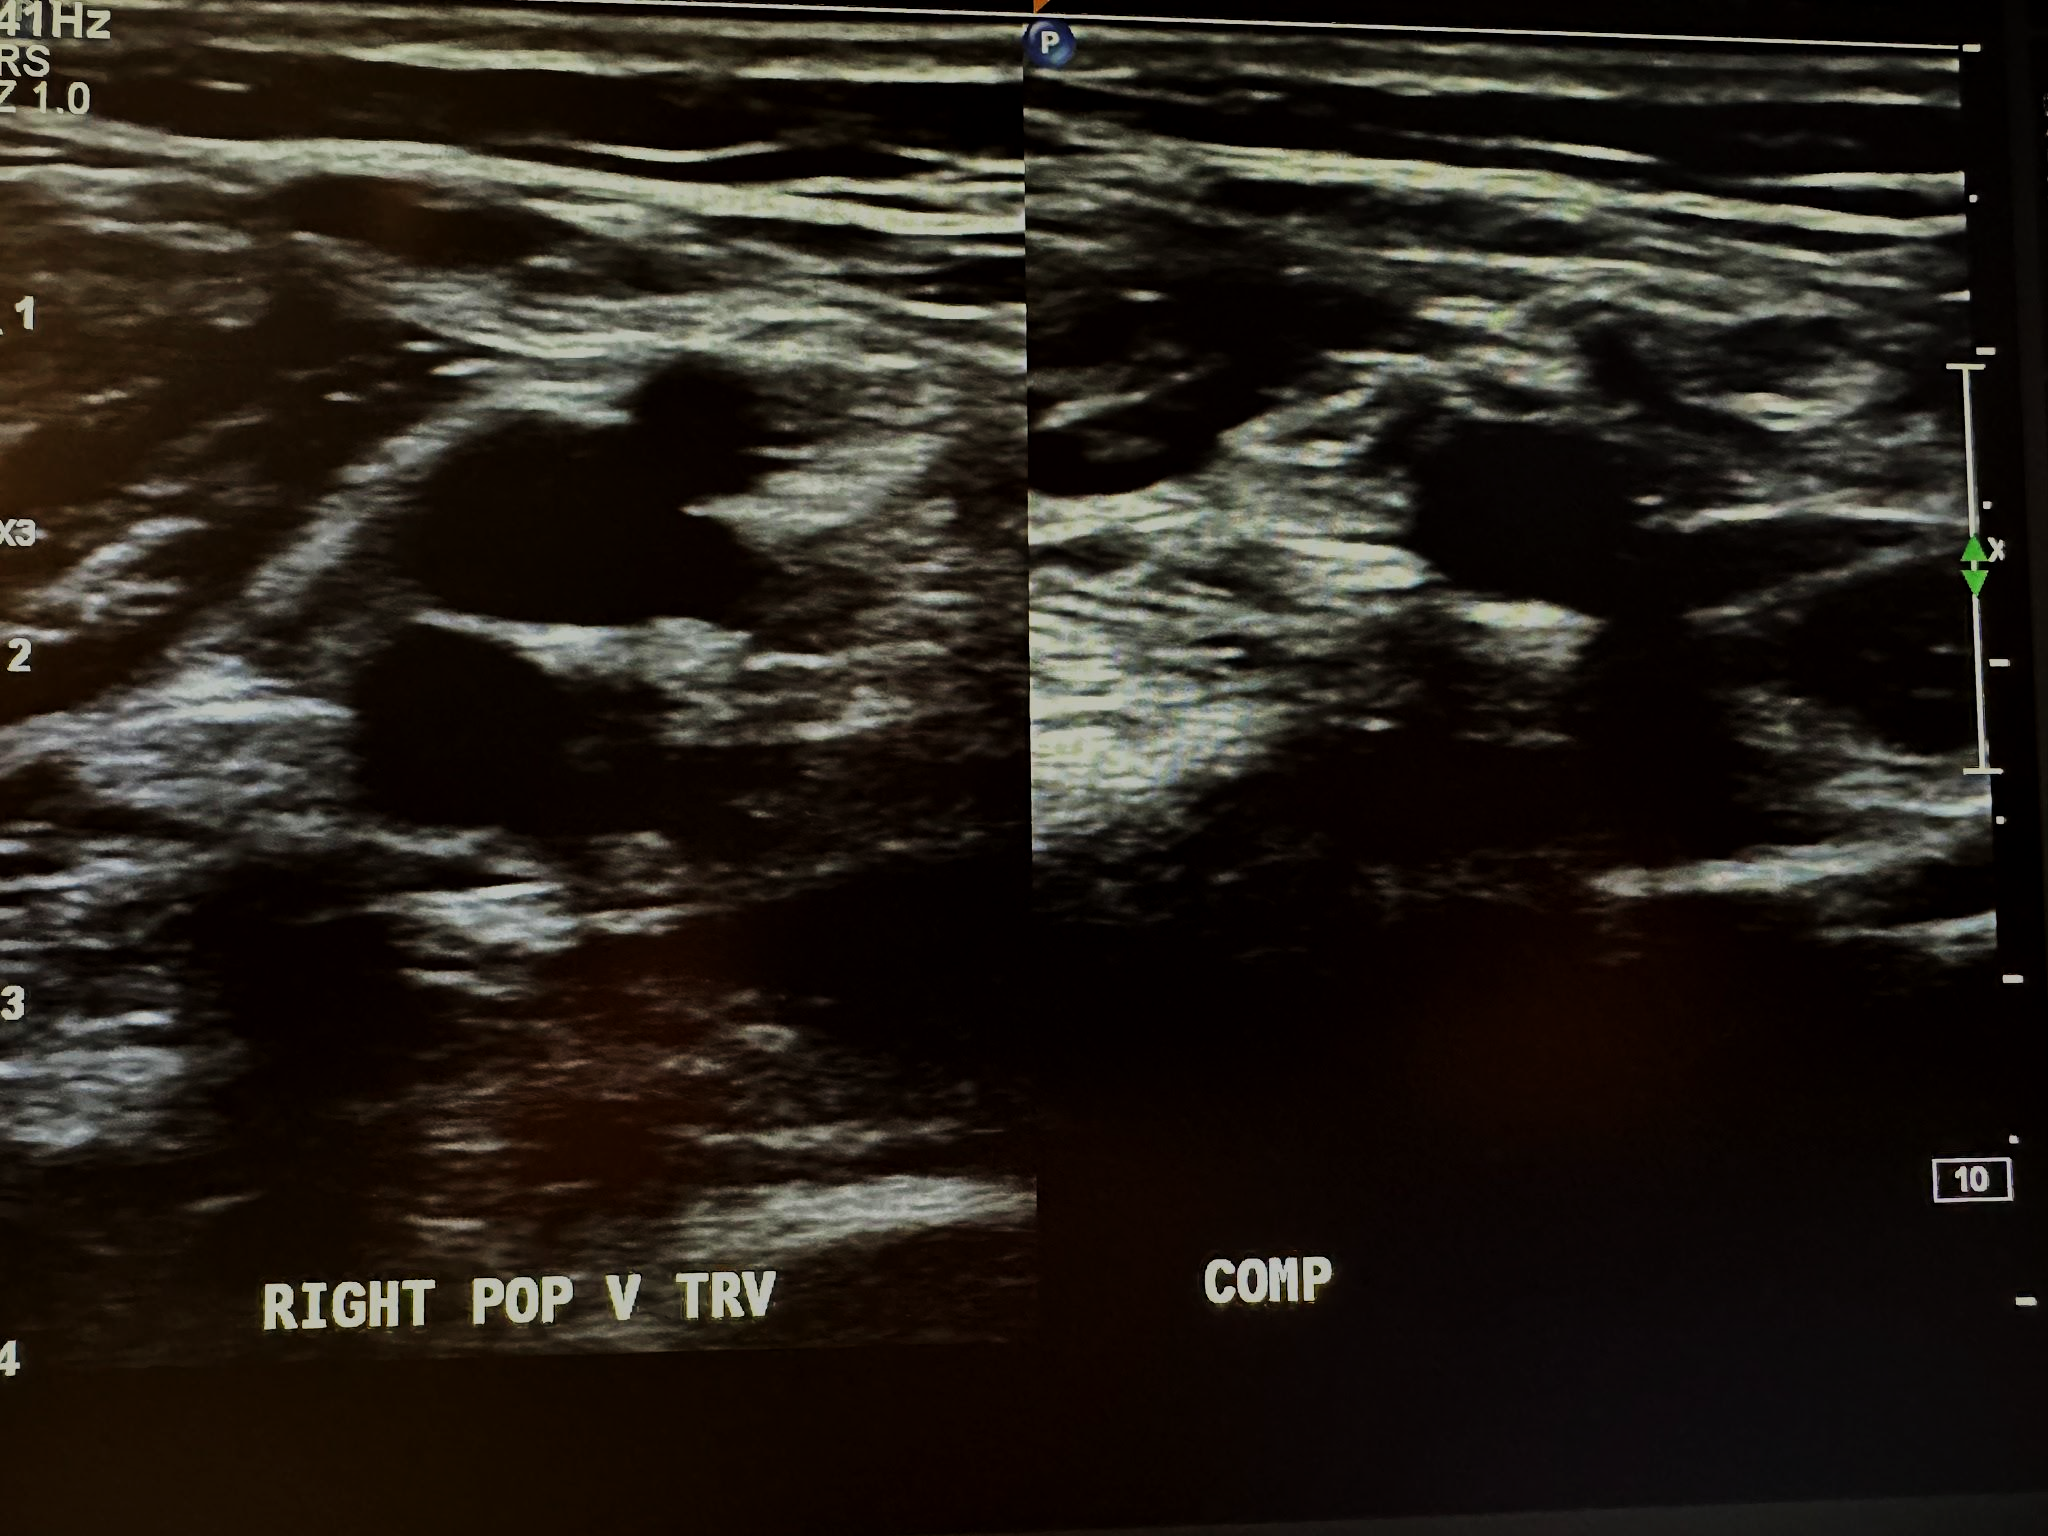

Figure 10-11 shows a side-by-side transverse ultrasound view of the right gastrocnemius vein without compression and with compression, while Figure 10-12 represents the sagittal view of the right gastrocnemius vein with augmentation.
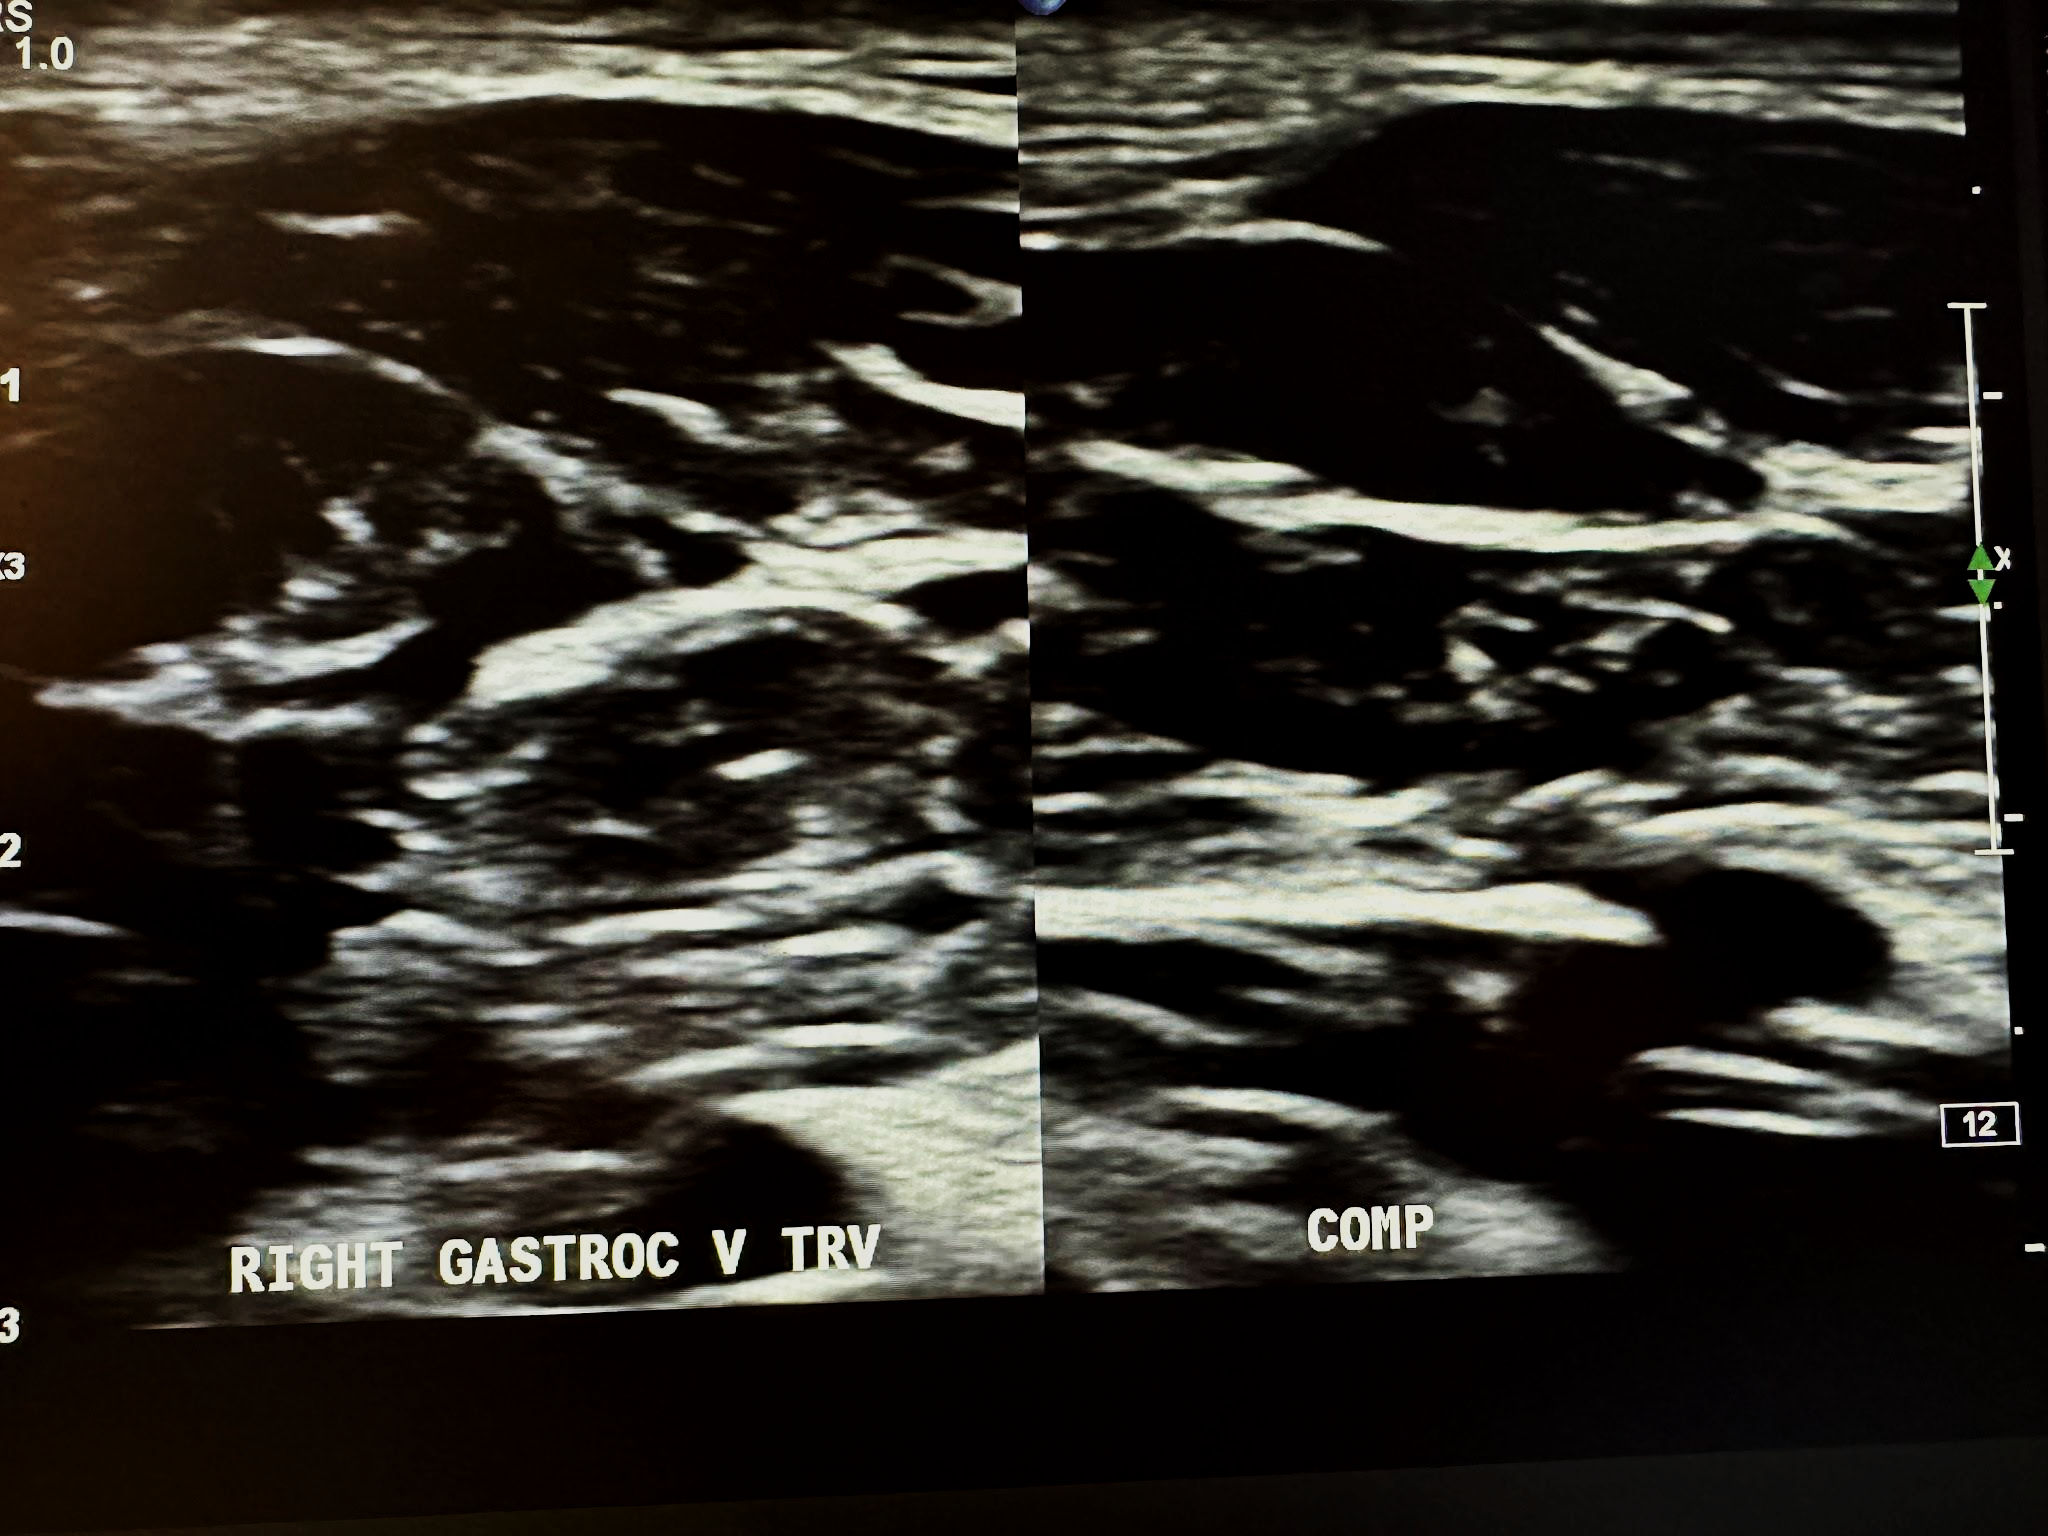

Figure 10-13 shows a side-by-side transverse ultrasound view of the right posterior tibial vein without compression and with compression, while Figure 10-14 represents the sagittal view of the right posterior tibial vein with augmentation.
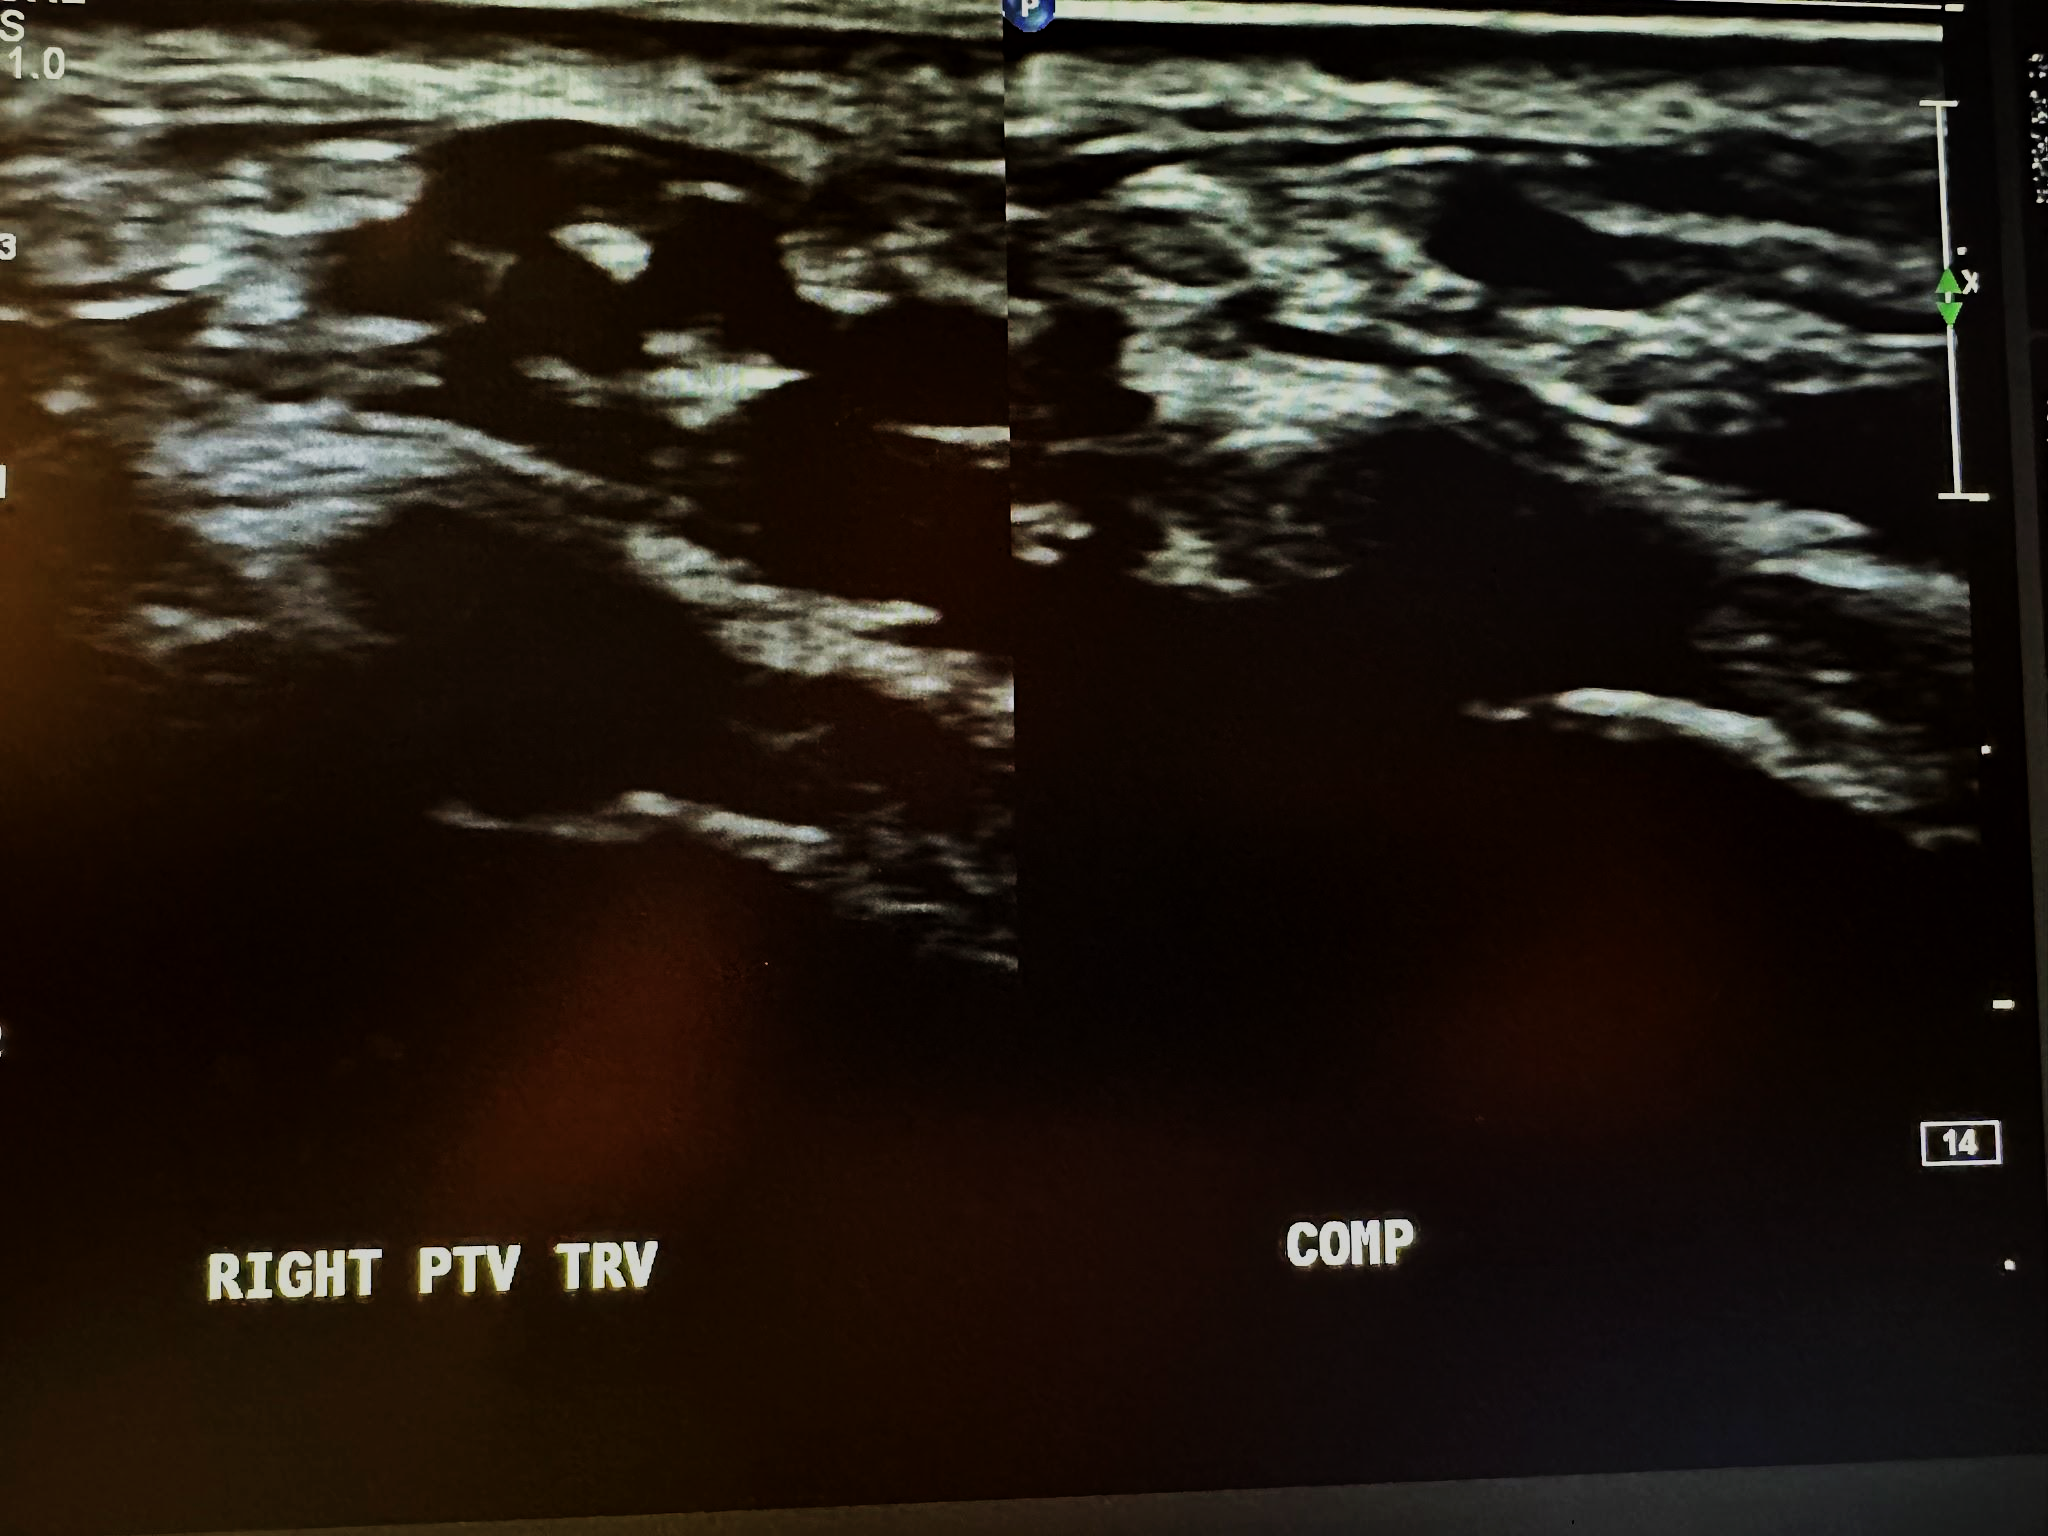

Figure 10-15 shows a side-by-side transverse ultrasound view of the right peroneal vein without compression and with compression, while Figure 10-16 represents the sagittal view of the right peroneal vein with augmentation.
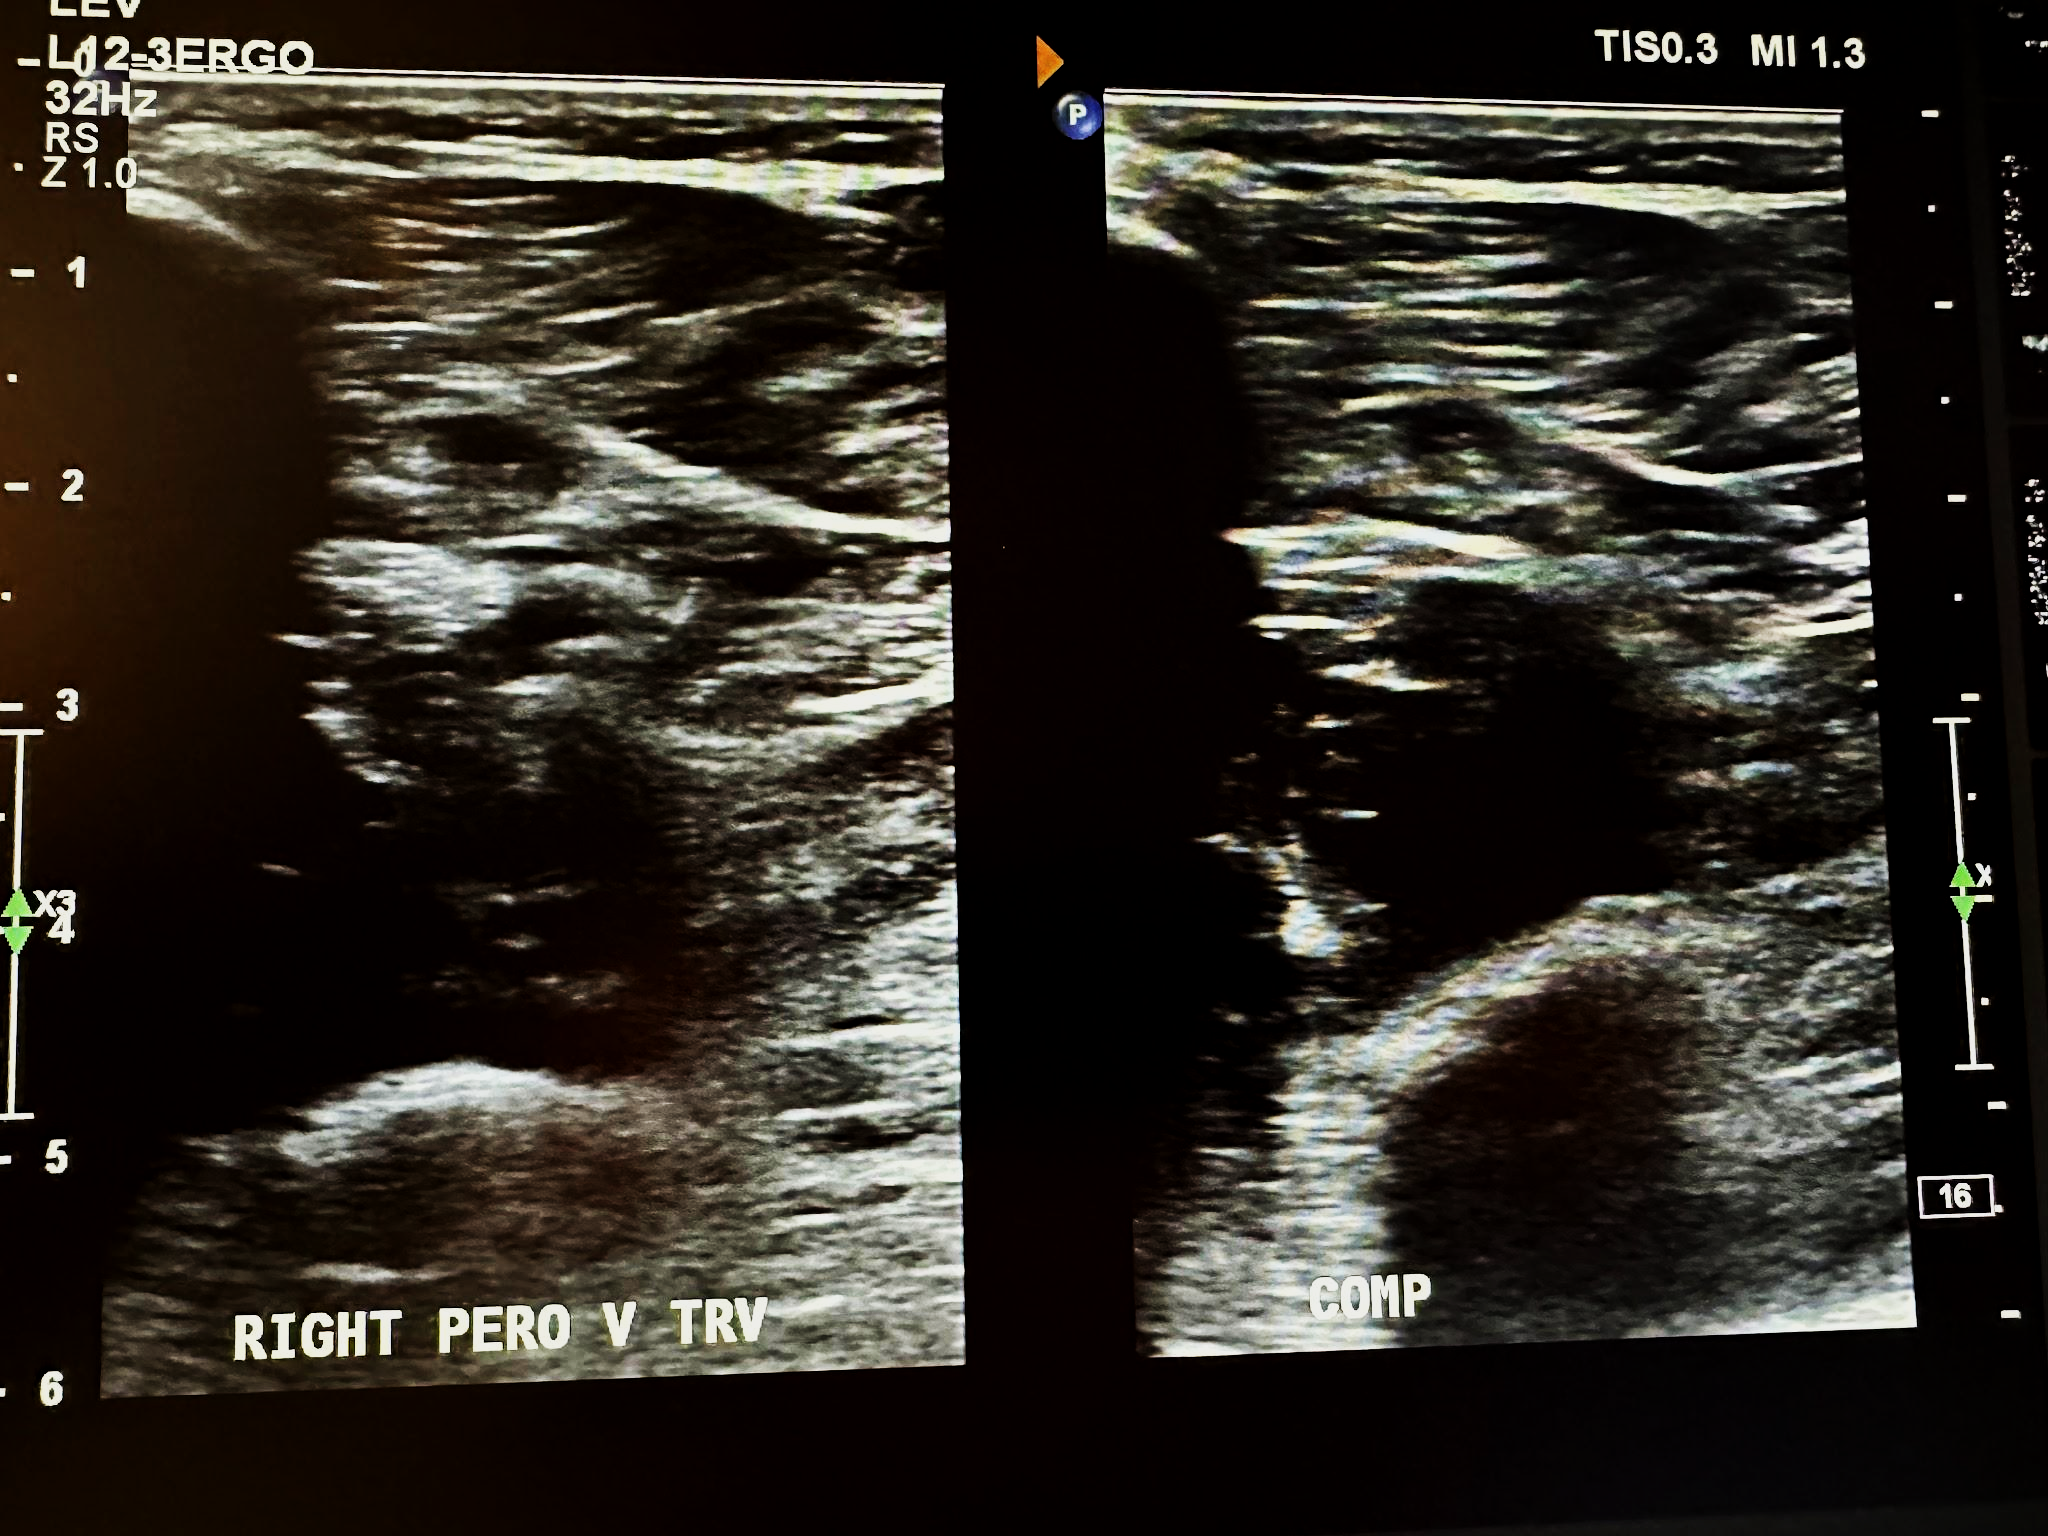
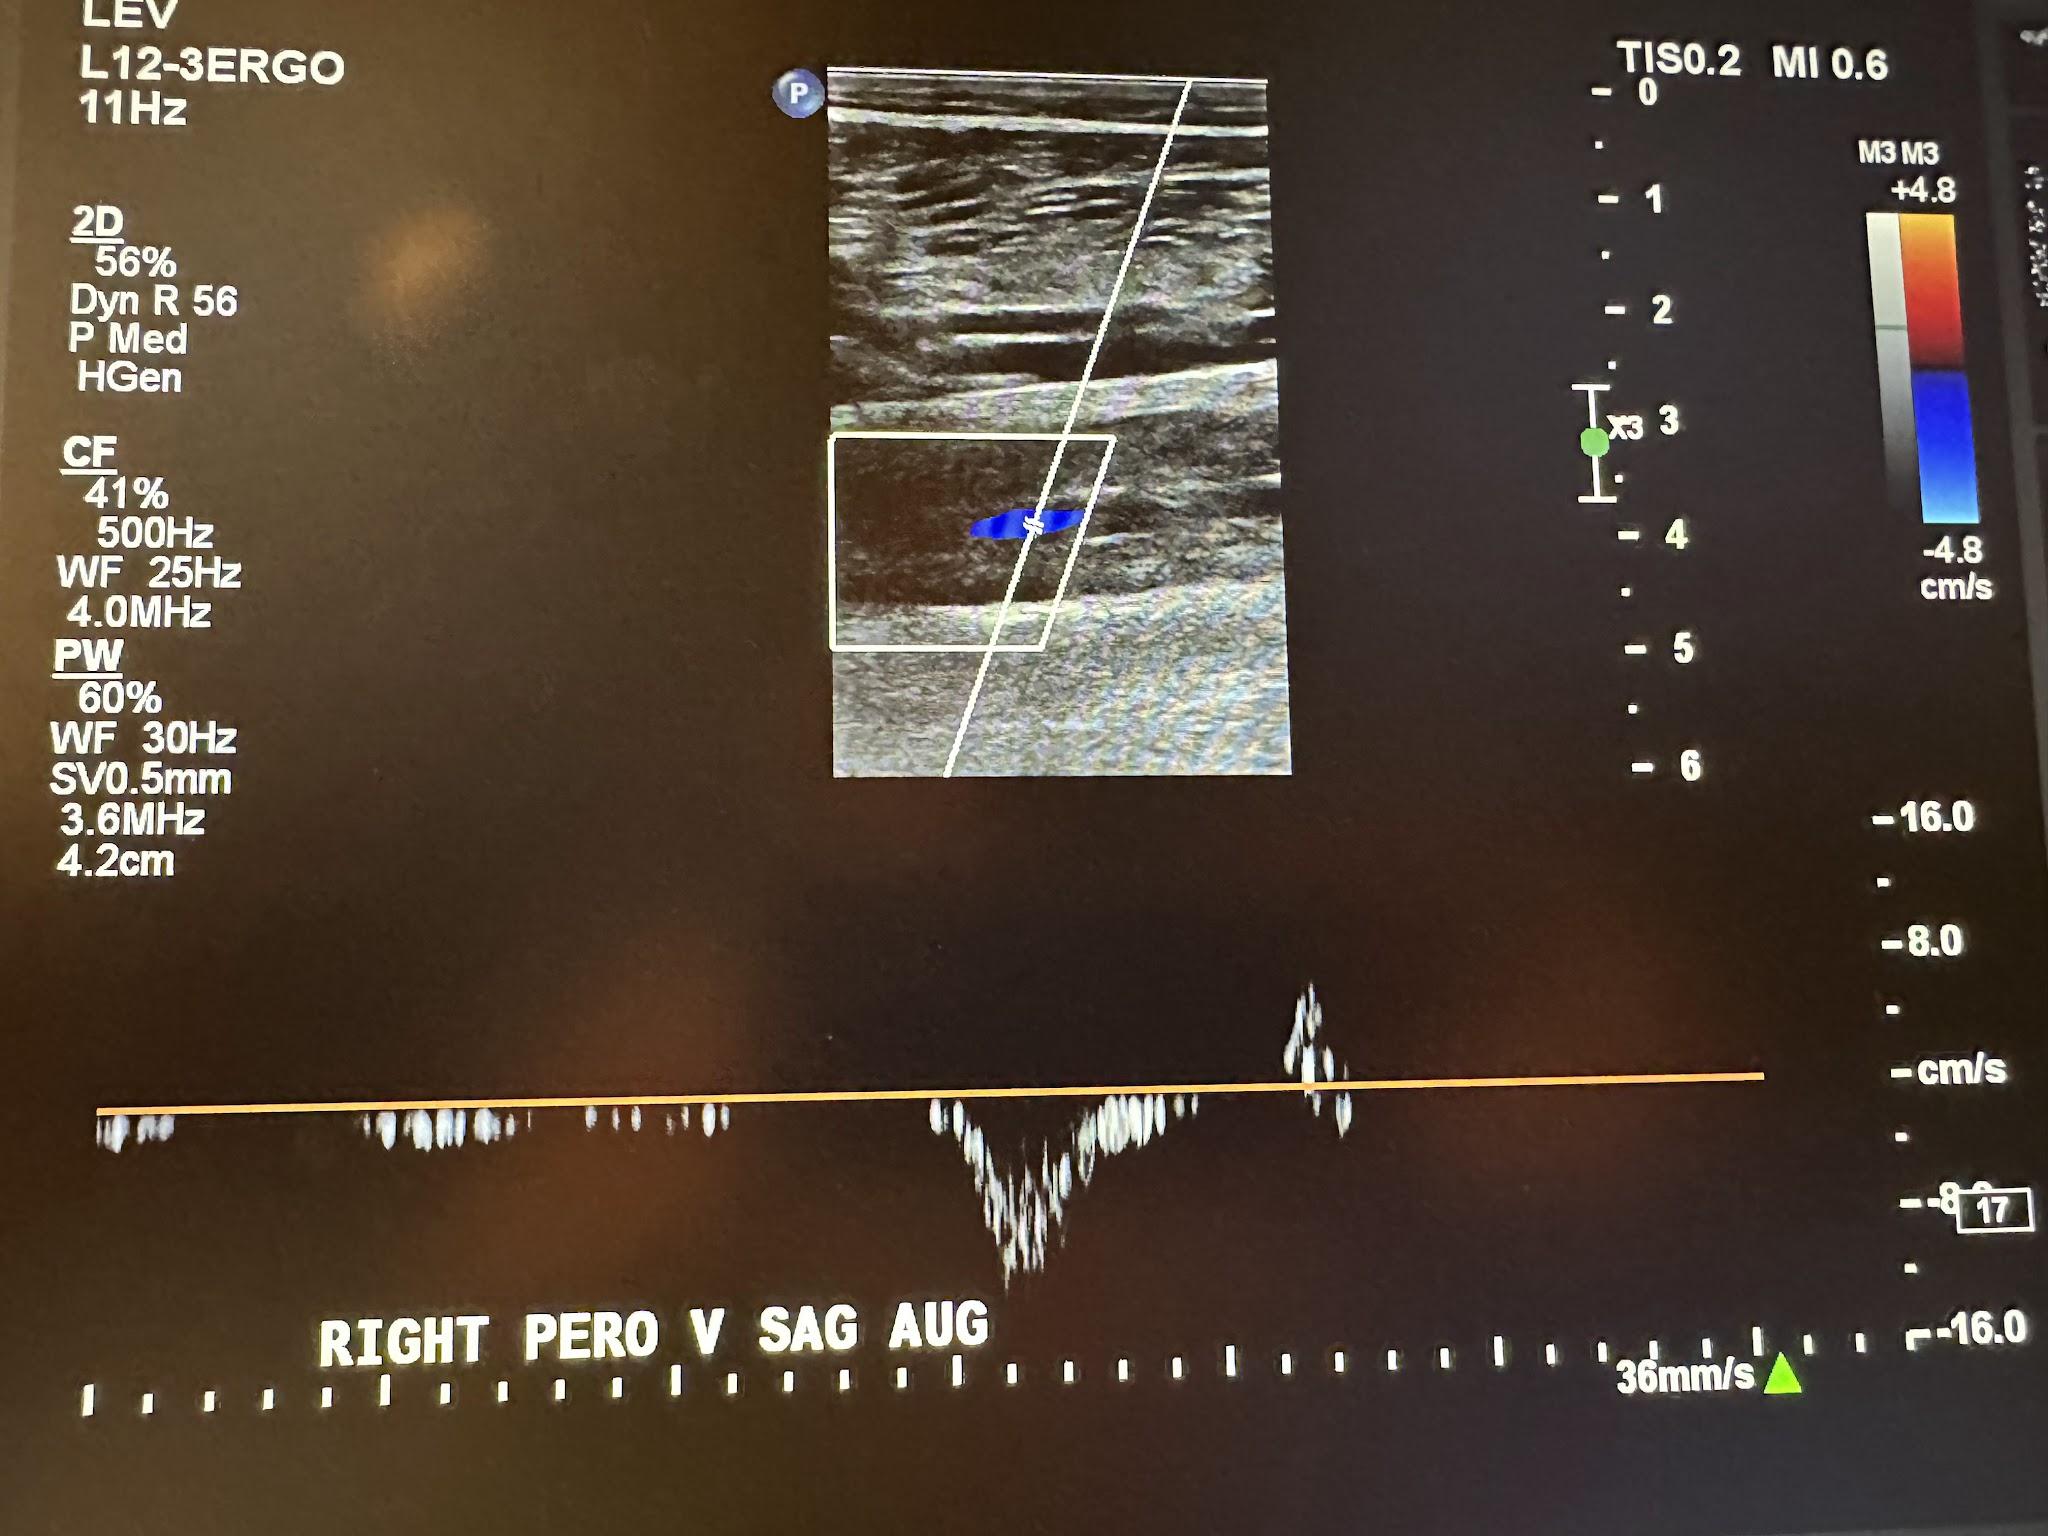
Figure 10-17 shows a side-by-side transverse ultrasound view of the anterior tibial vein without compression and with compression, while Figure 10-18 represents the sagittal view of the right anterior tibial vein with augmentation.

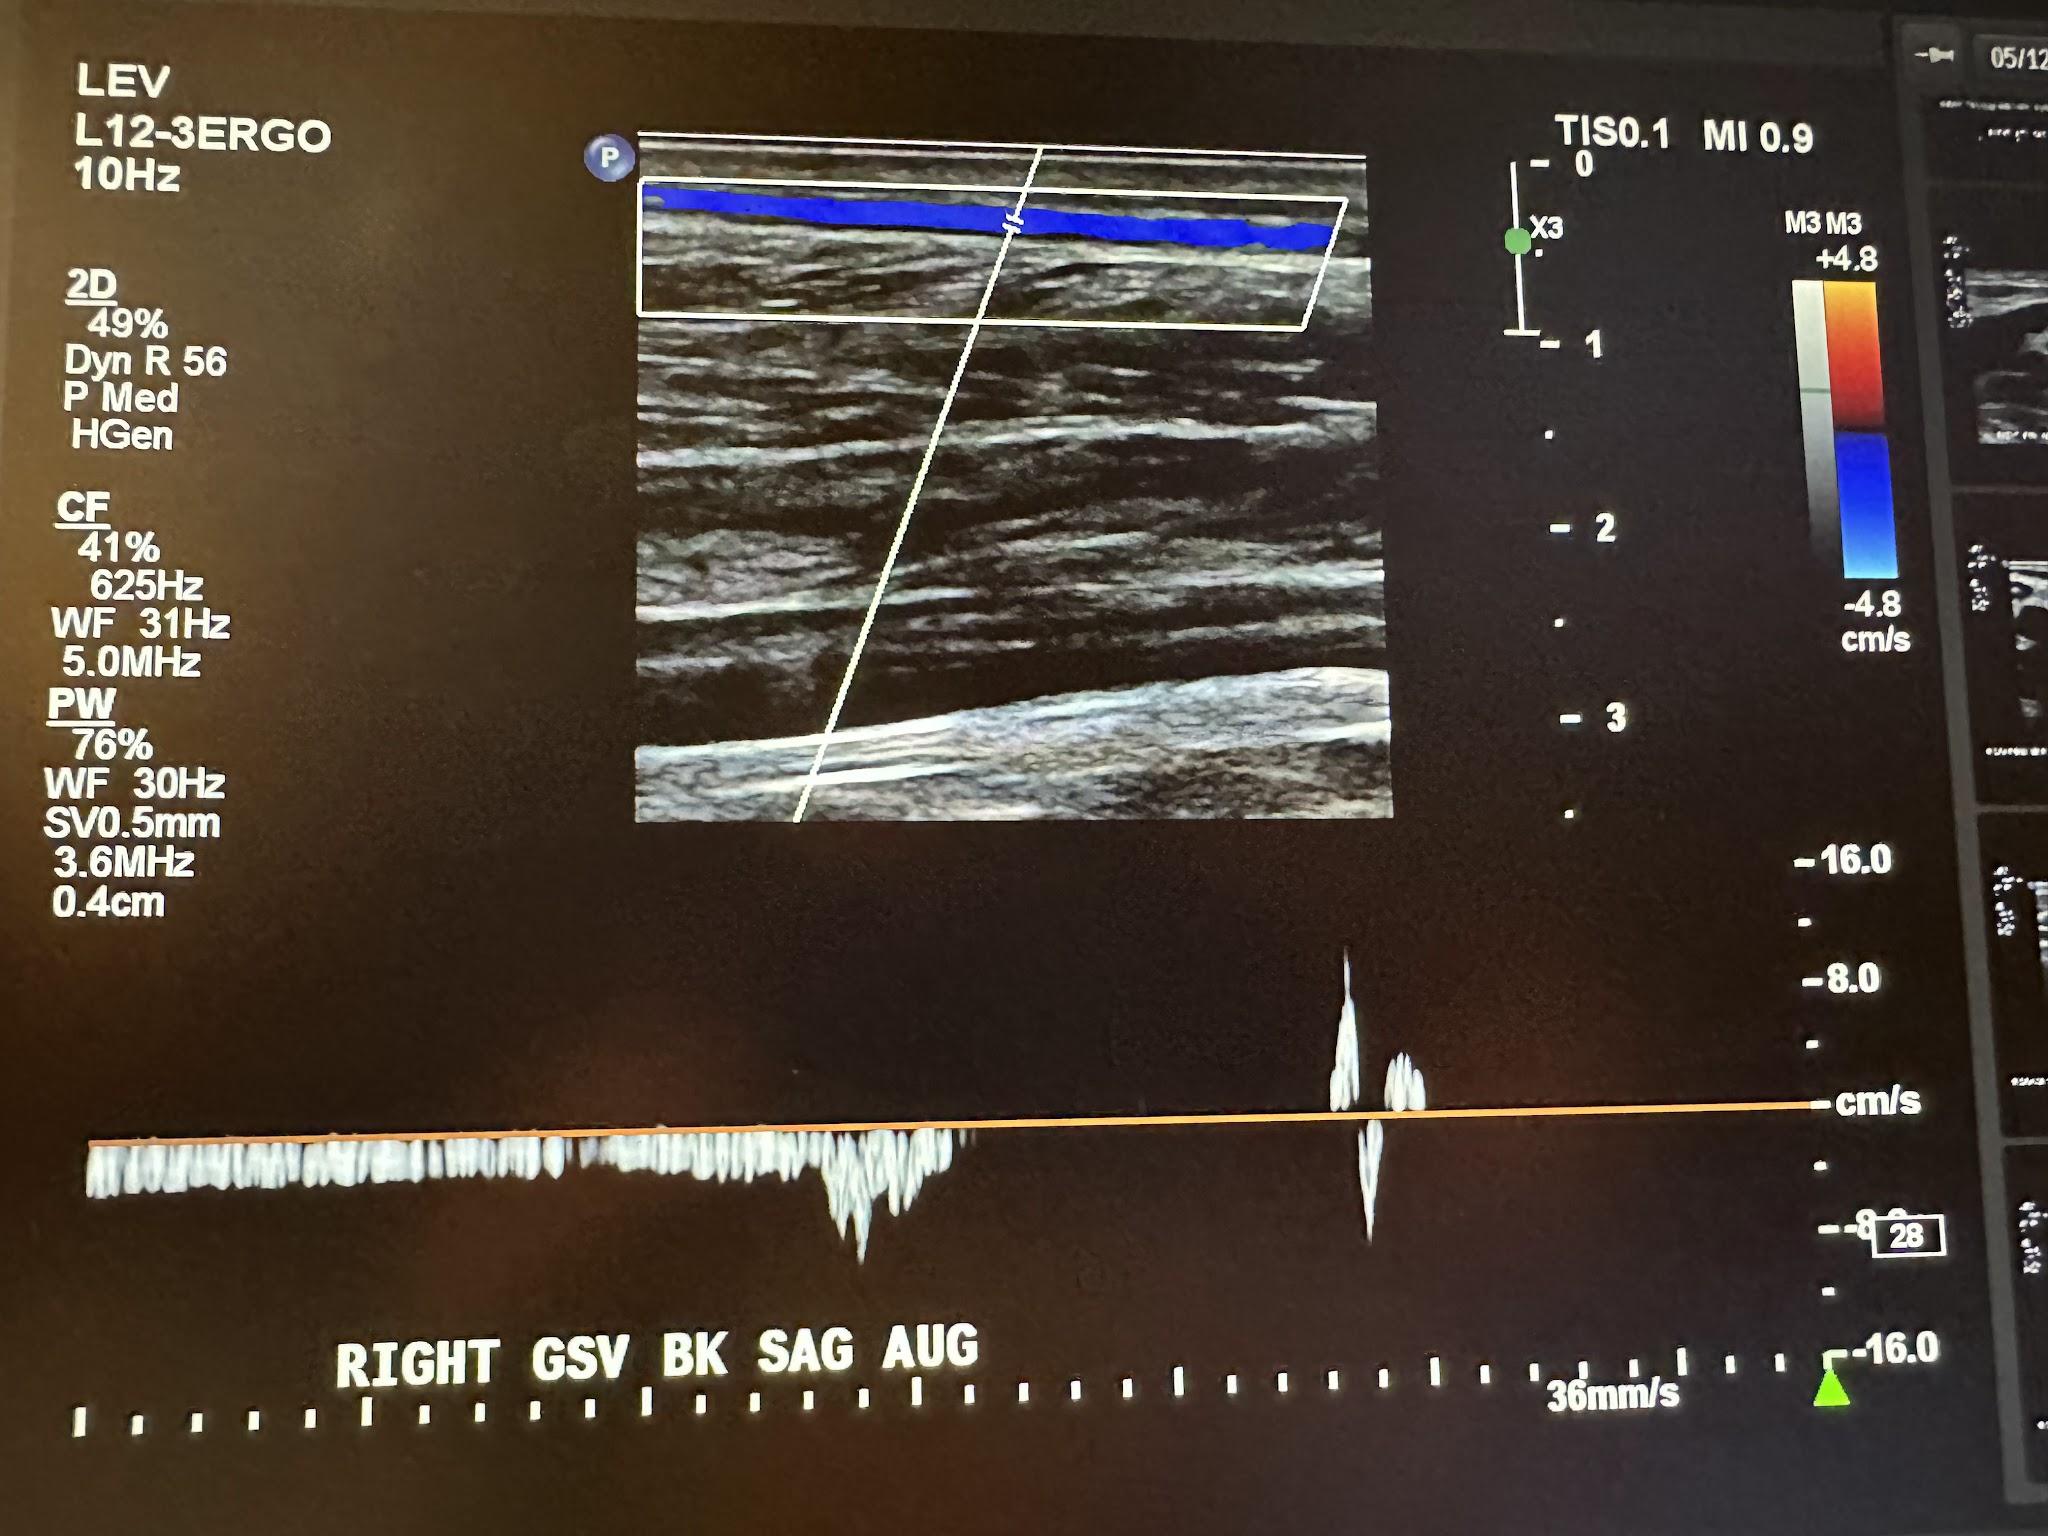
Next, in the complete venous duplex ultrasound, we look at the superficial venous system from proximal to distal, starting with the GSV at the SFJ in the transverse plane with a side-by-side image without and with color Doppler, followed by a sagittal image with augmentation with color Doppler. Figure 10-19 shows a side-by-side transverse ultrasound view of the right GSV at the SFJ, while Figure 10-20 represents the sagittal view of the right GSV at the SFJ with augmentation.

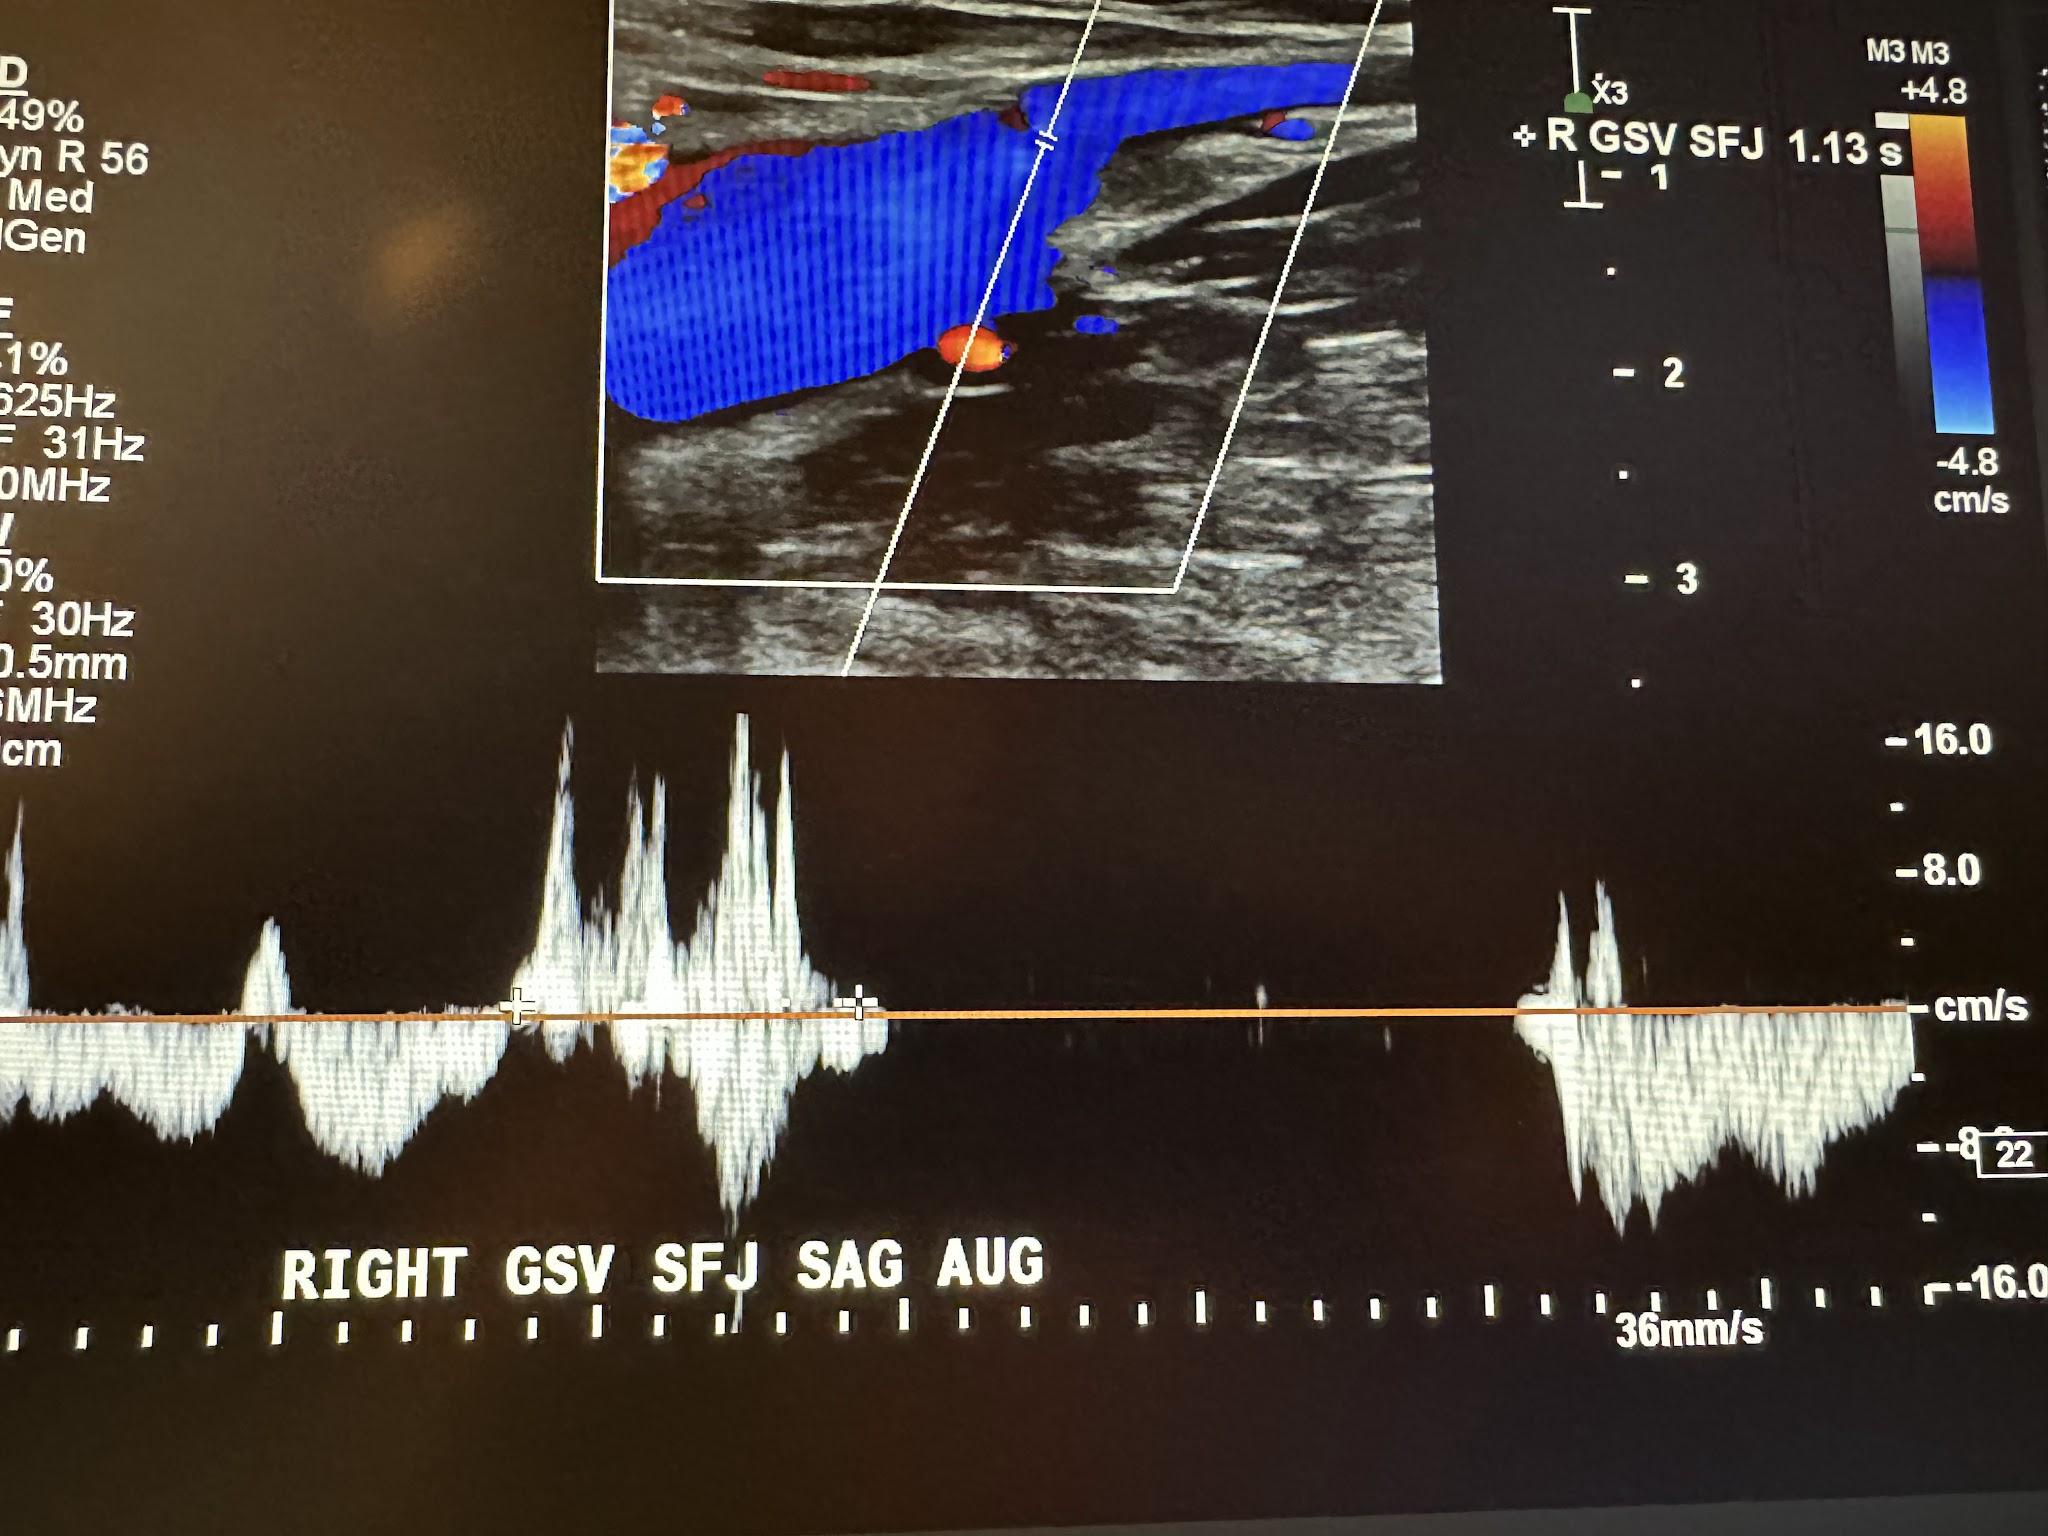
Next, we continue to follow and evaluate the GSV distally from above the knee (AK) to below the knee (BK) in the transverse plane without color, followed by the sagittal plane with augmentation with color Doppler. The abbreviations AK and BK have been used in the ultrasound images discussed here. Figure 10-21 shows a side-by-side transverse ultrasound view of the right GSV above the knee. Figure 10-22 represents the sagittal view of the right GSV above the knee with augmentation.
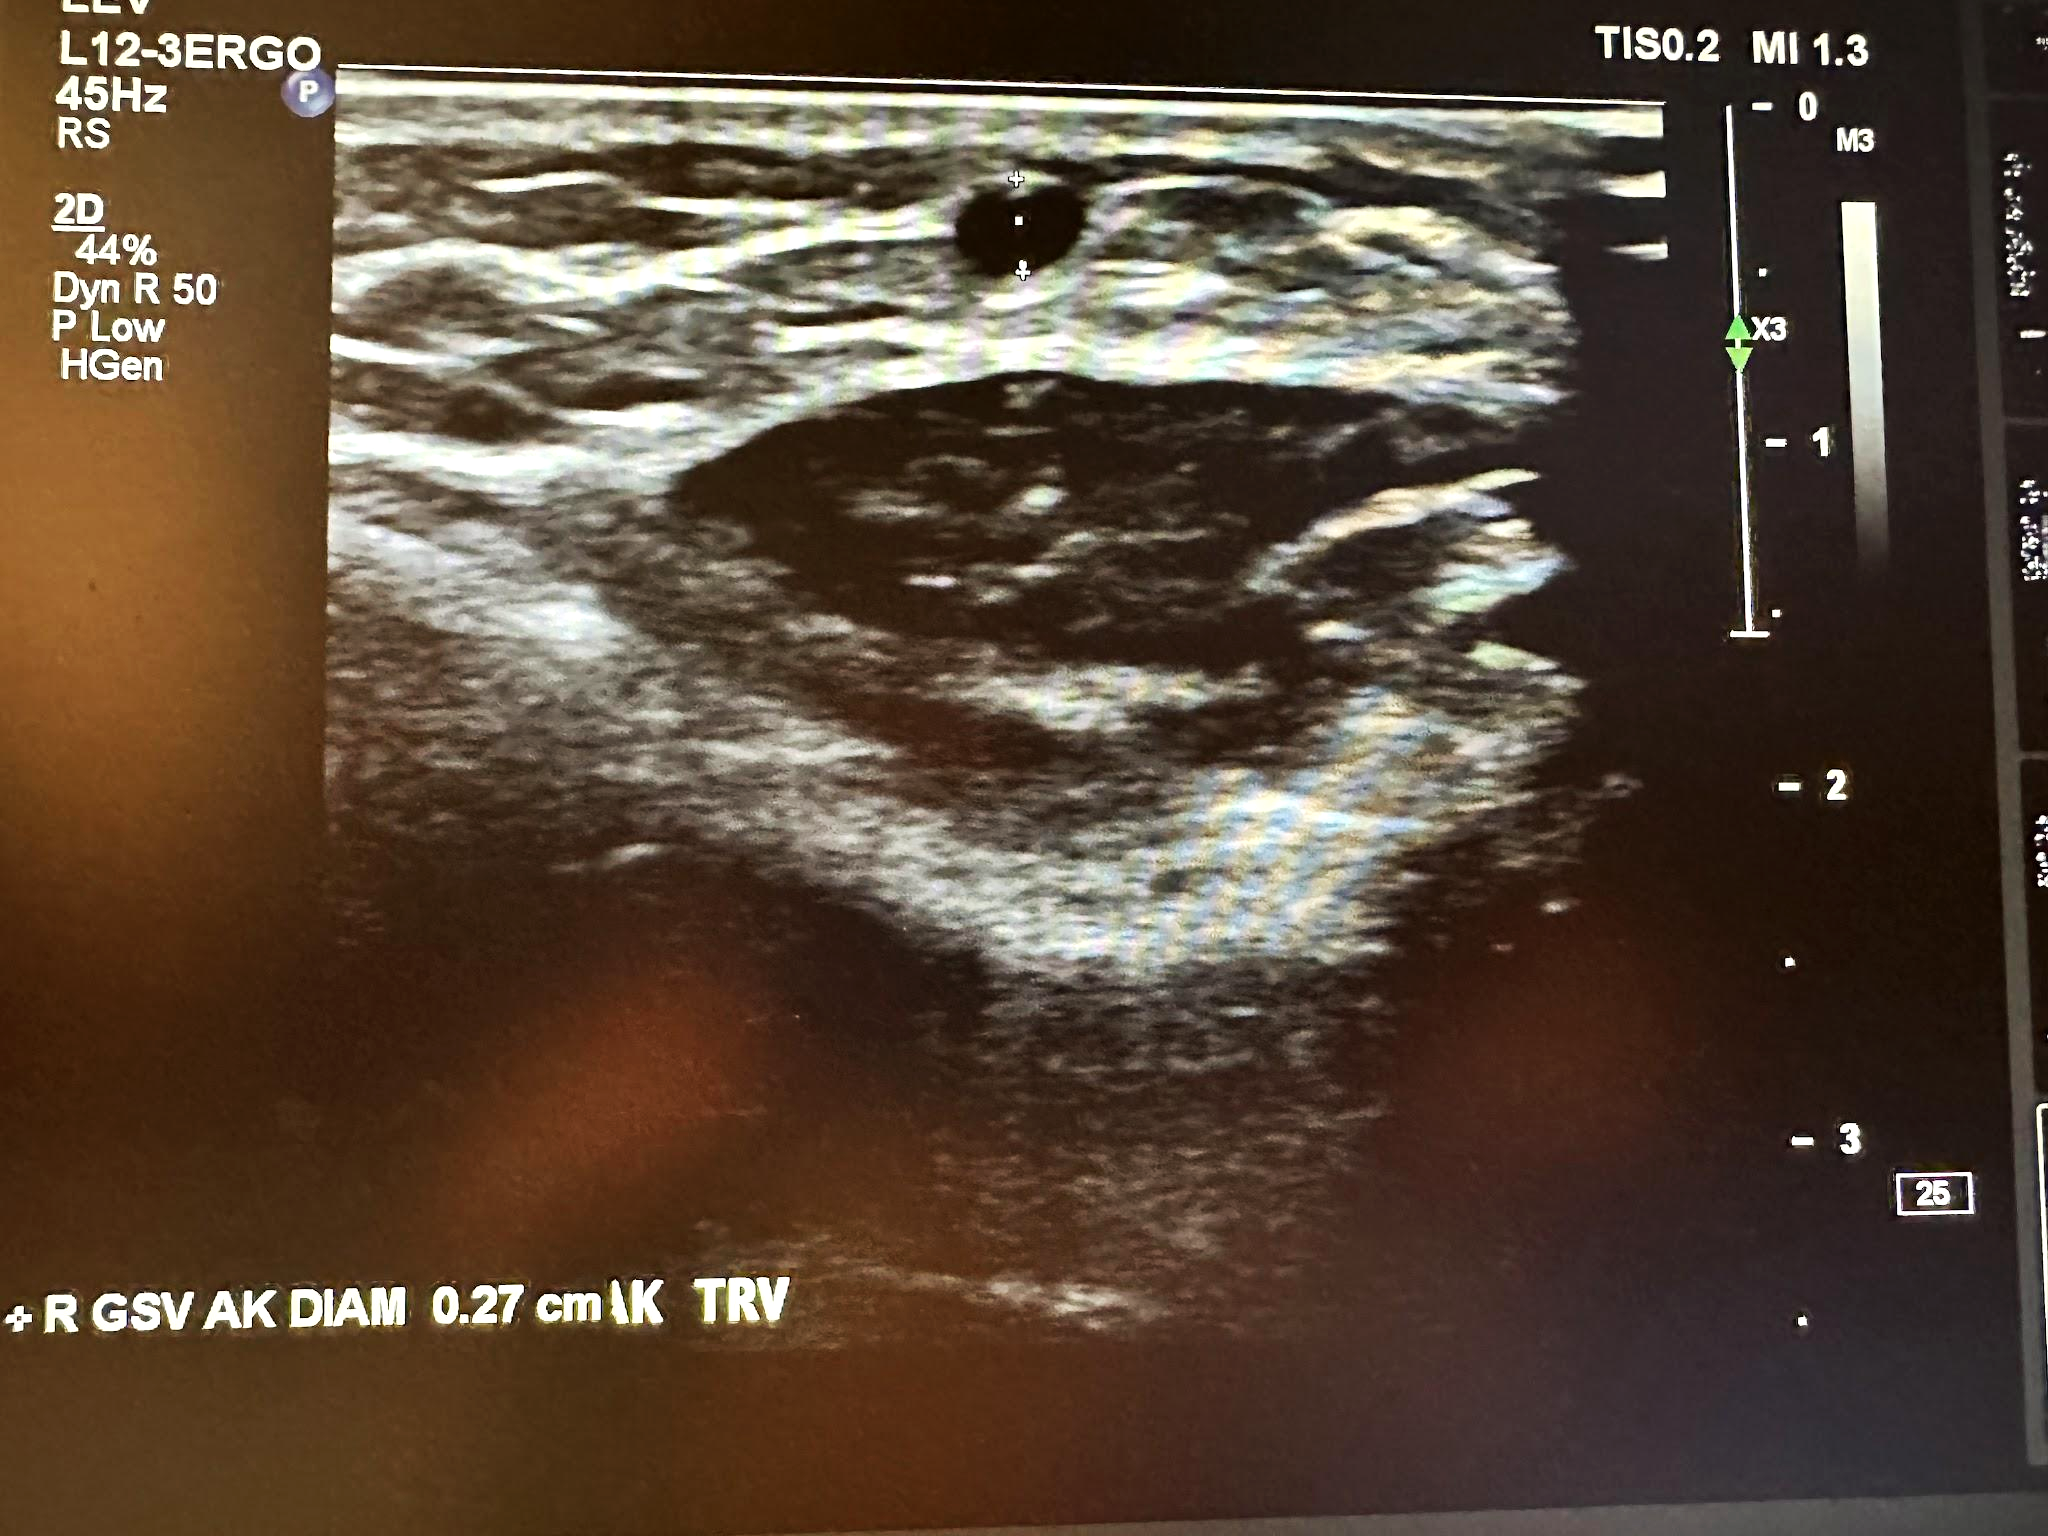
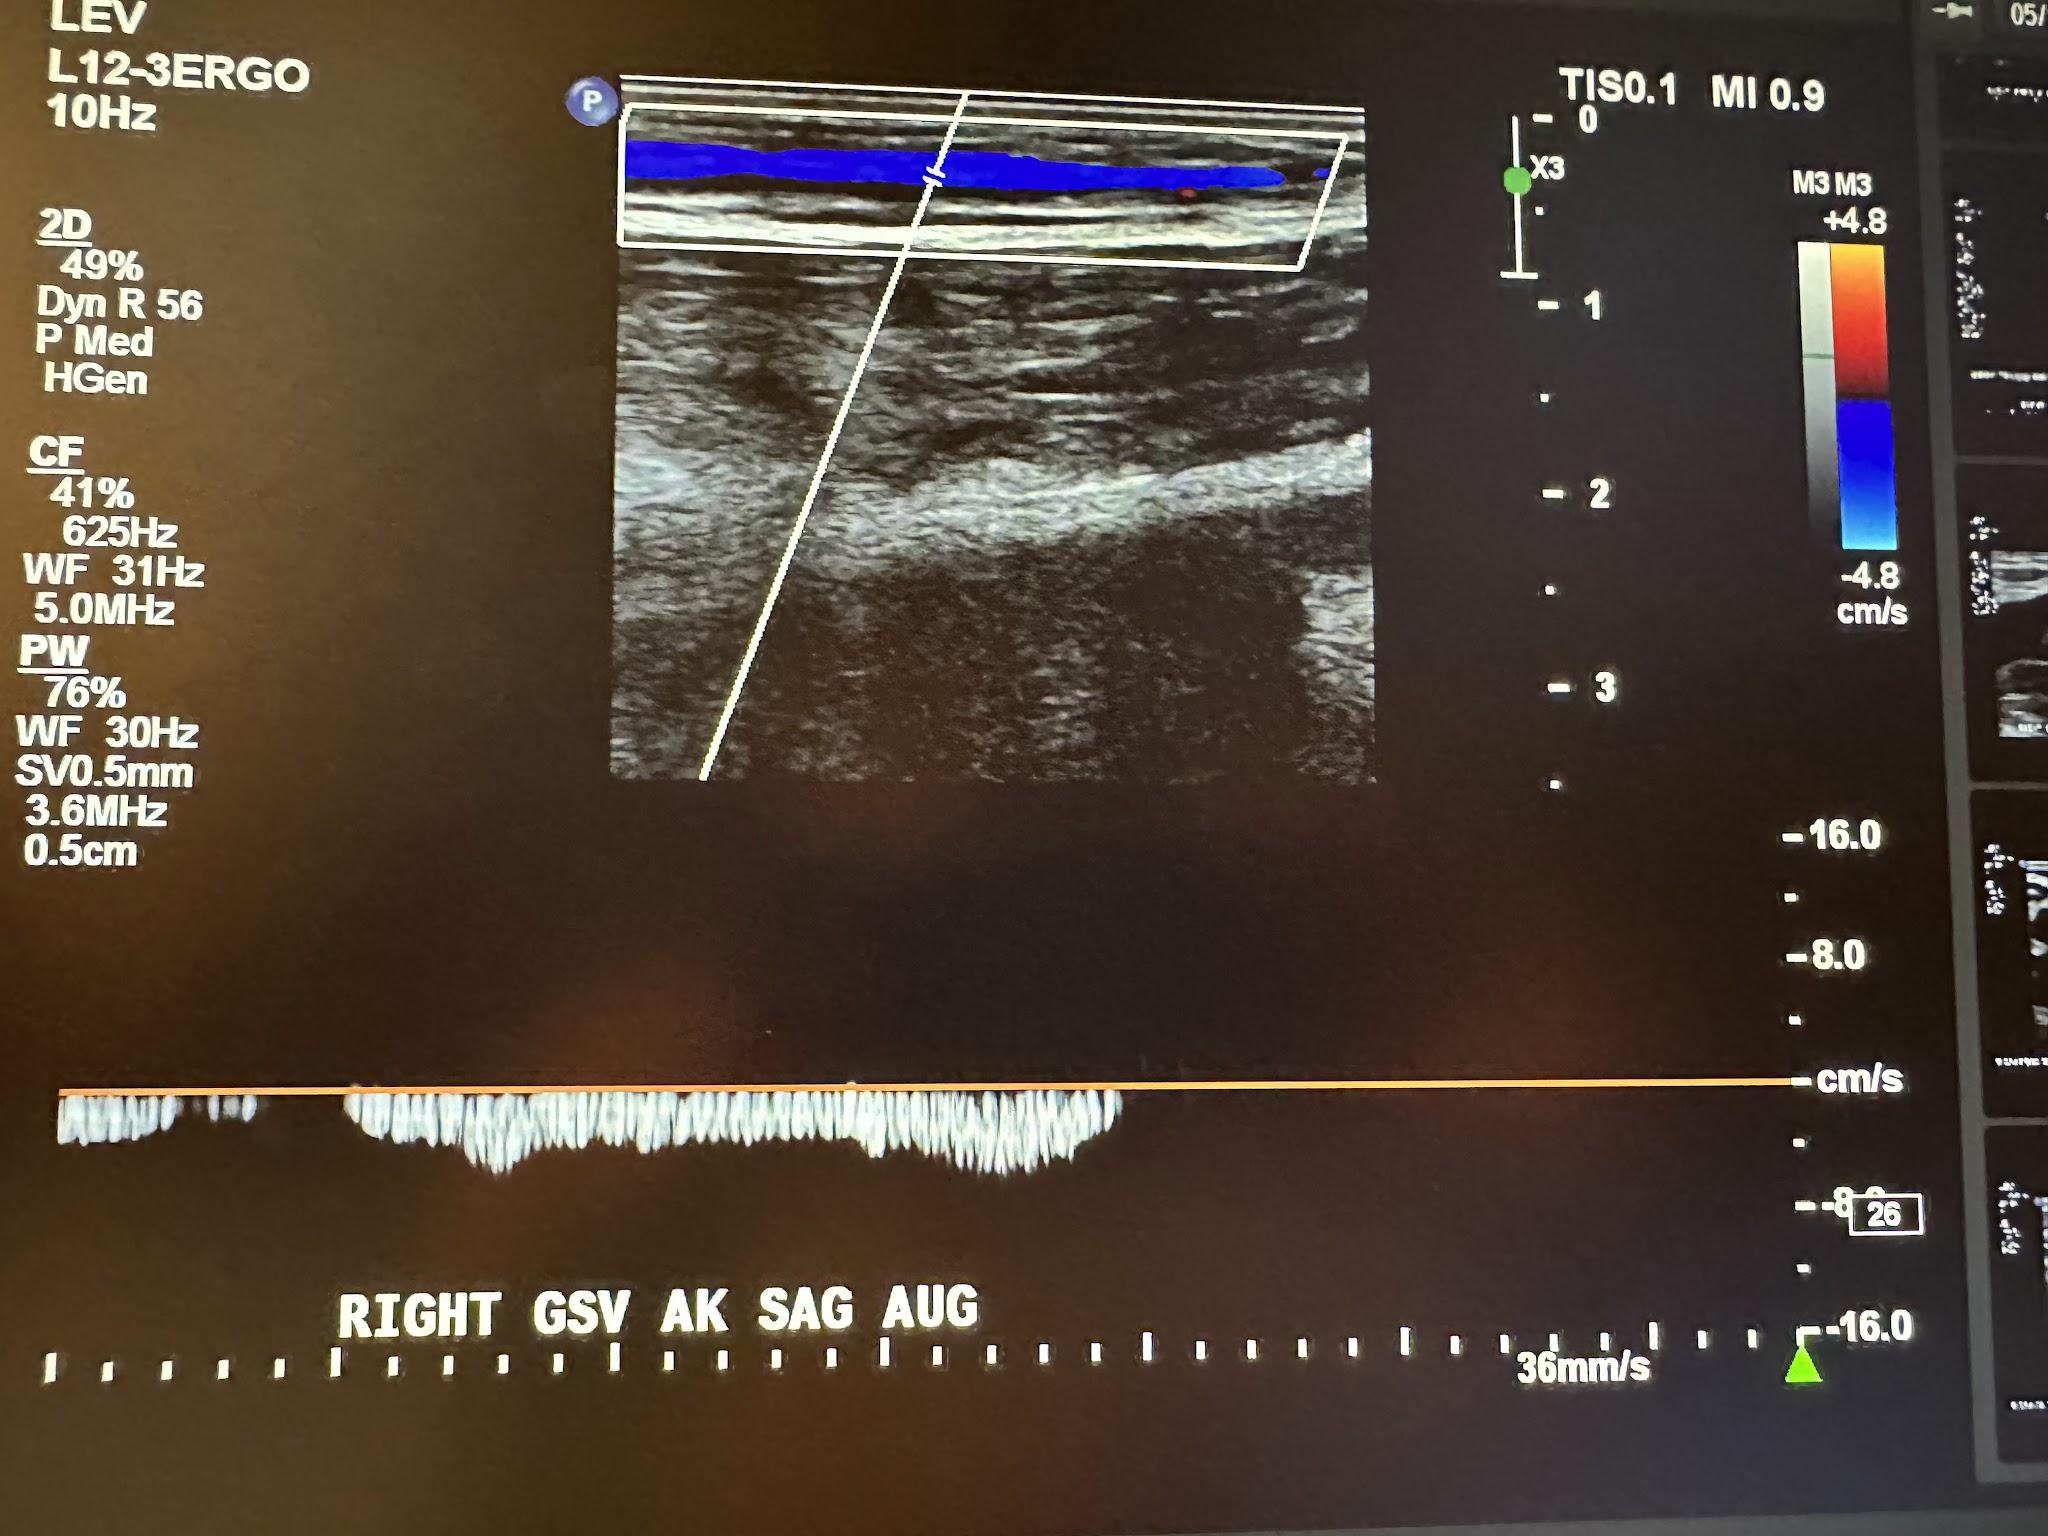
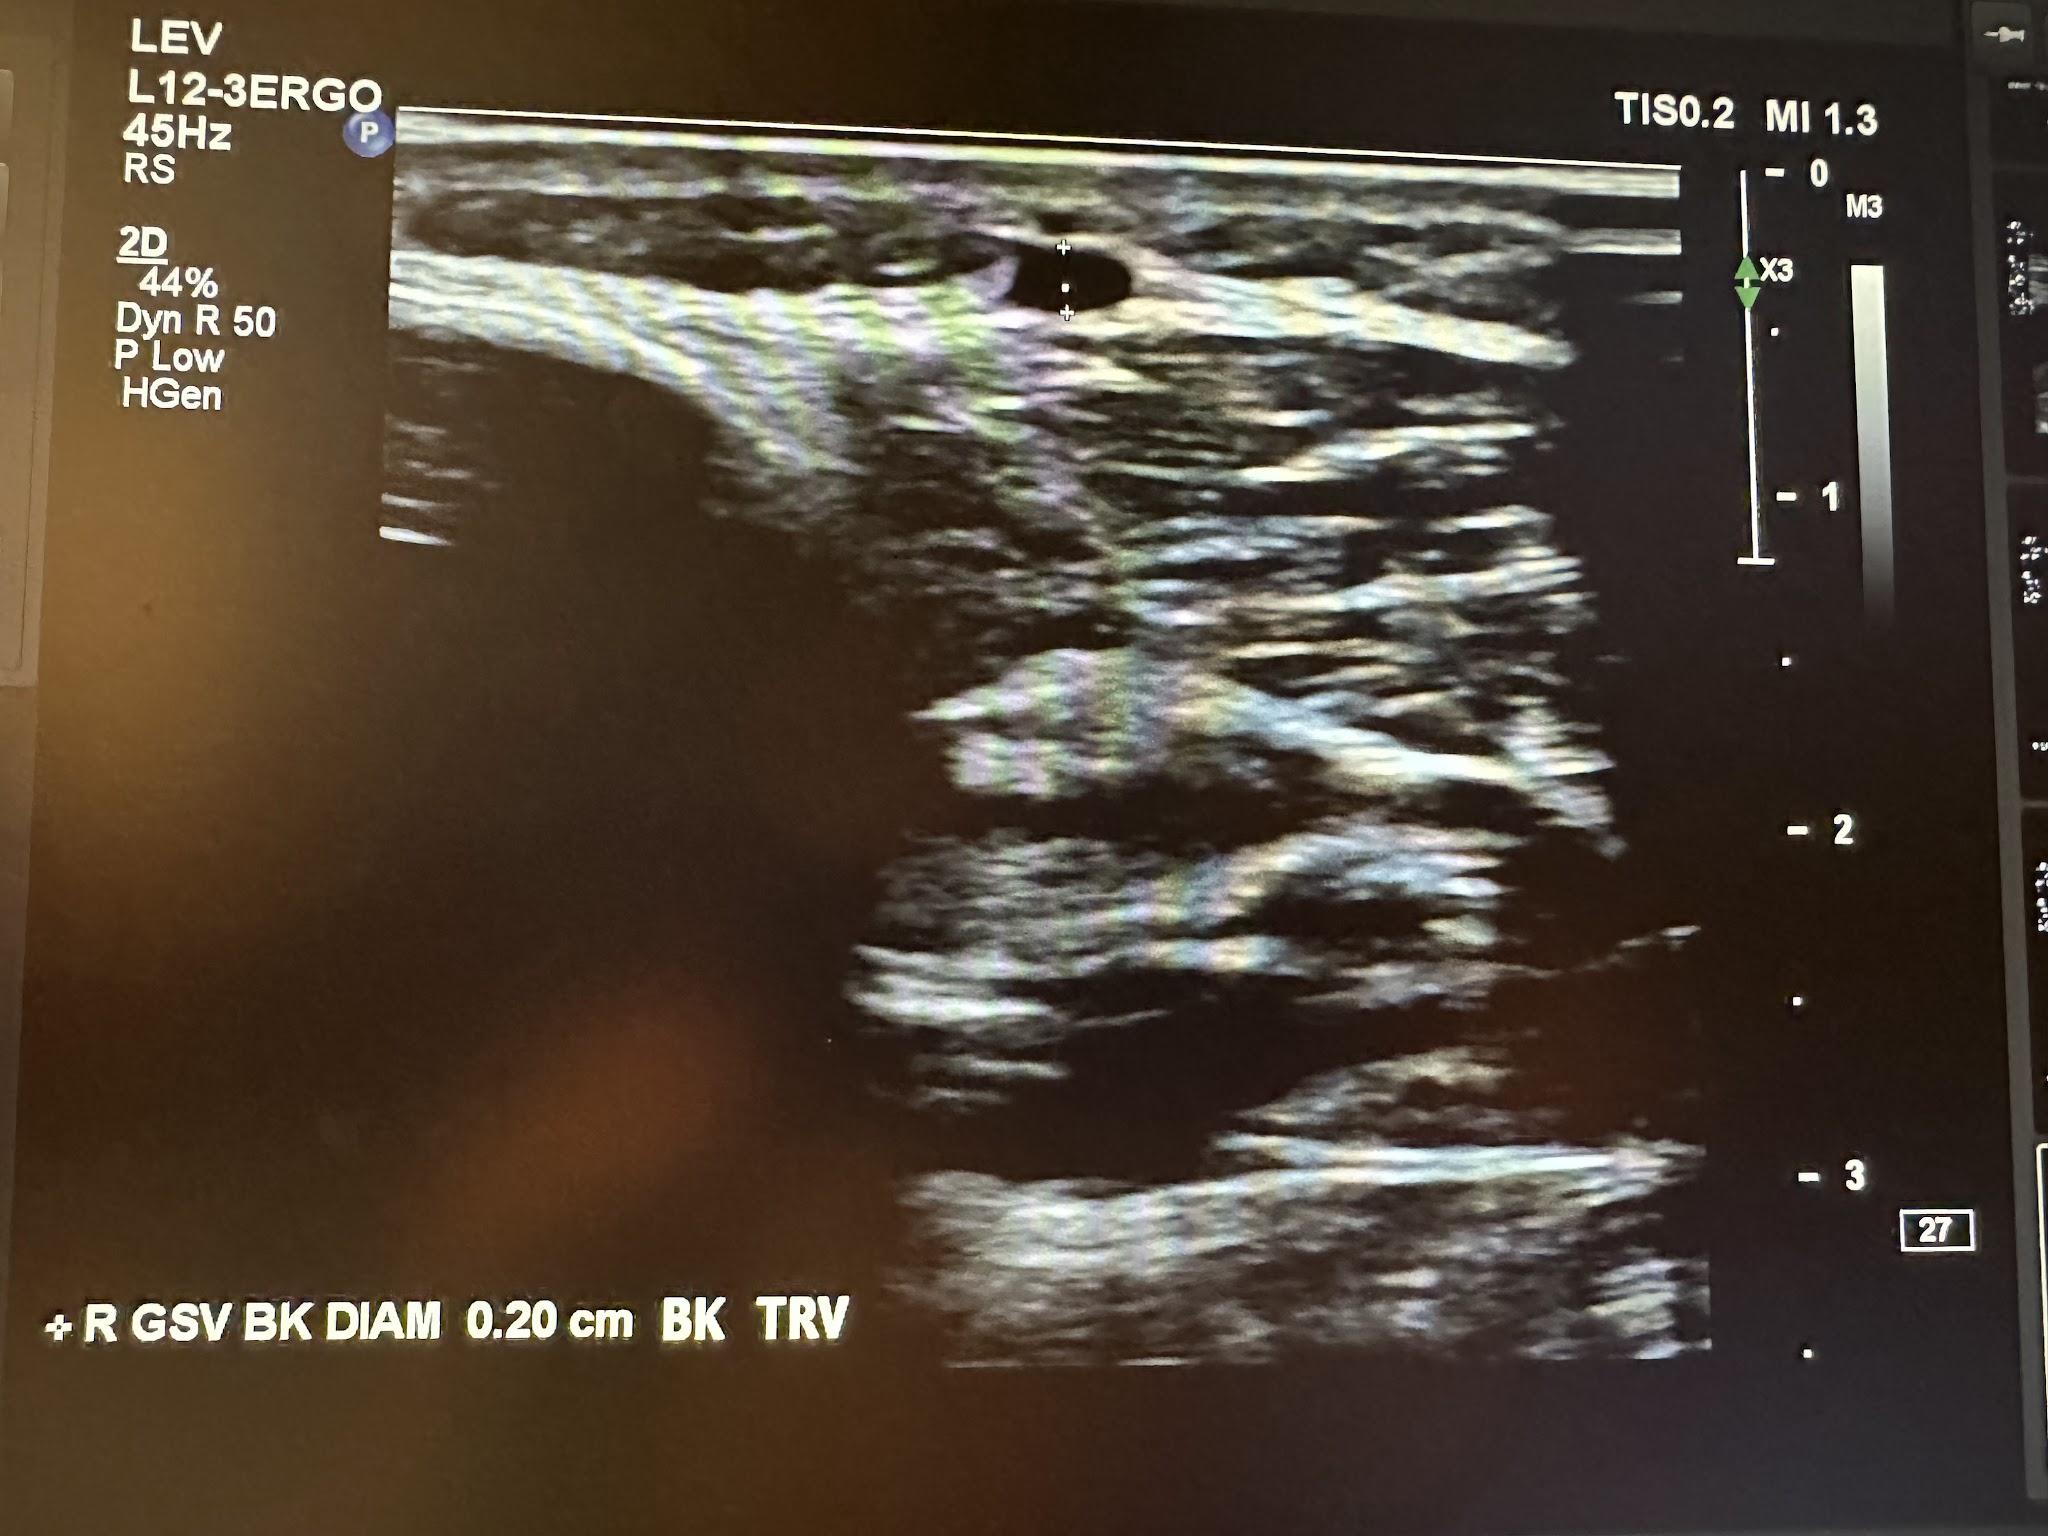
Figure 10-23 shows a transverse ultrasound view of the right GSV below the knee, while Figure 10-24 represents the sagittal view of the right GSV below the knee with augmentation.
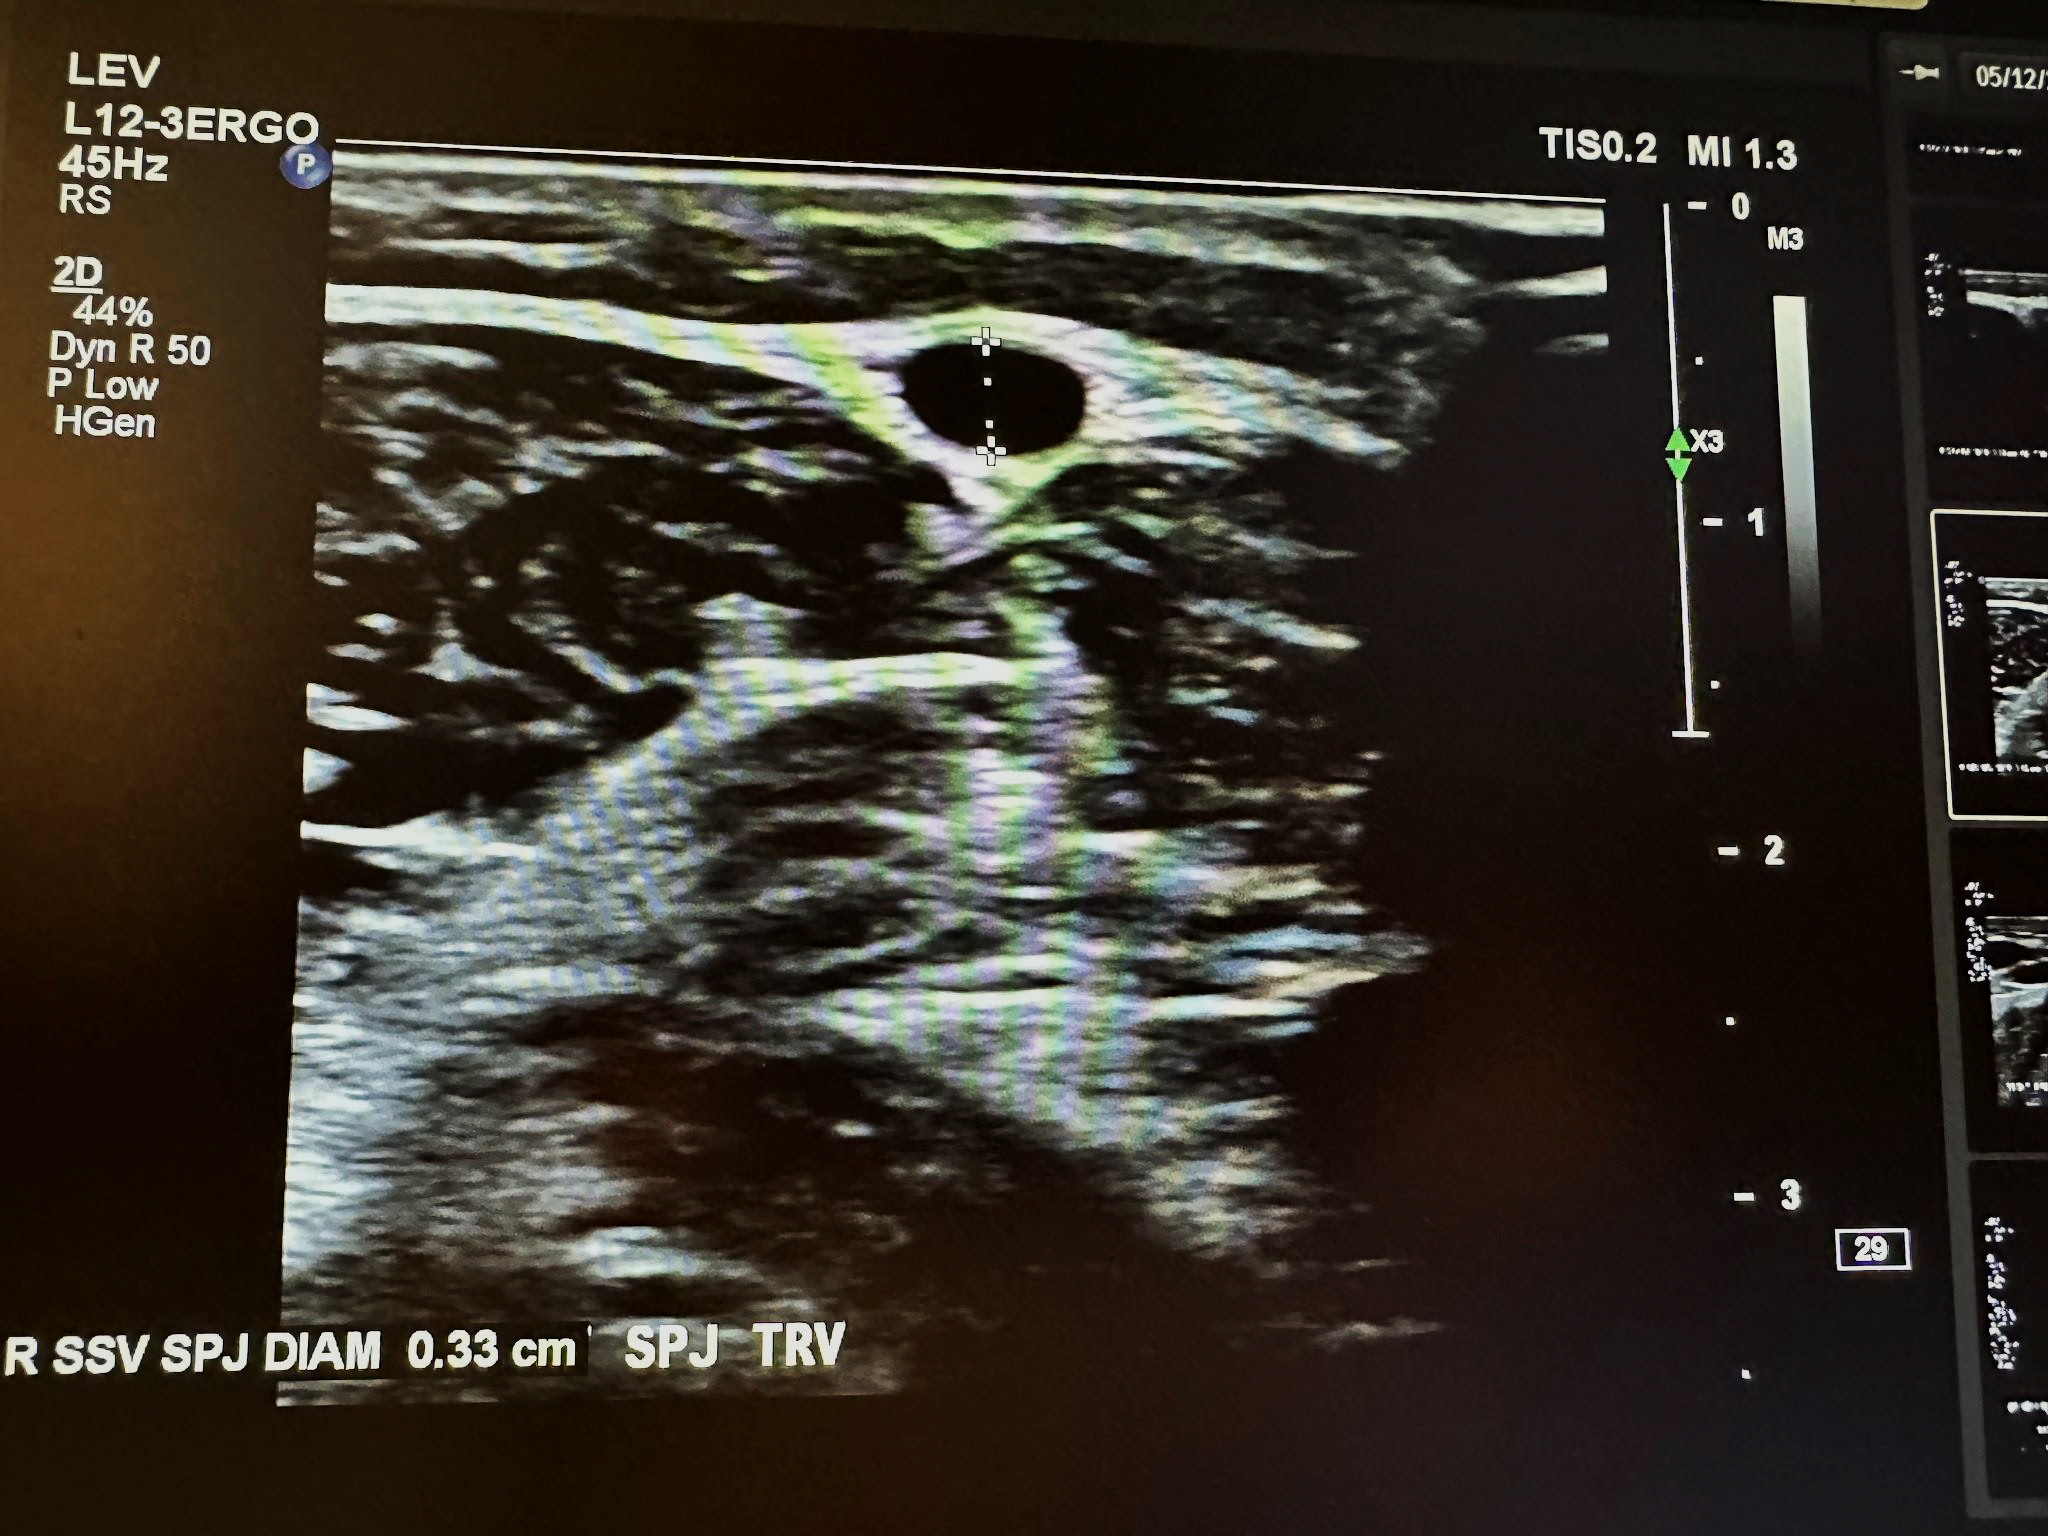
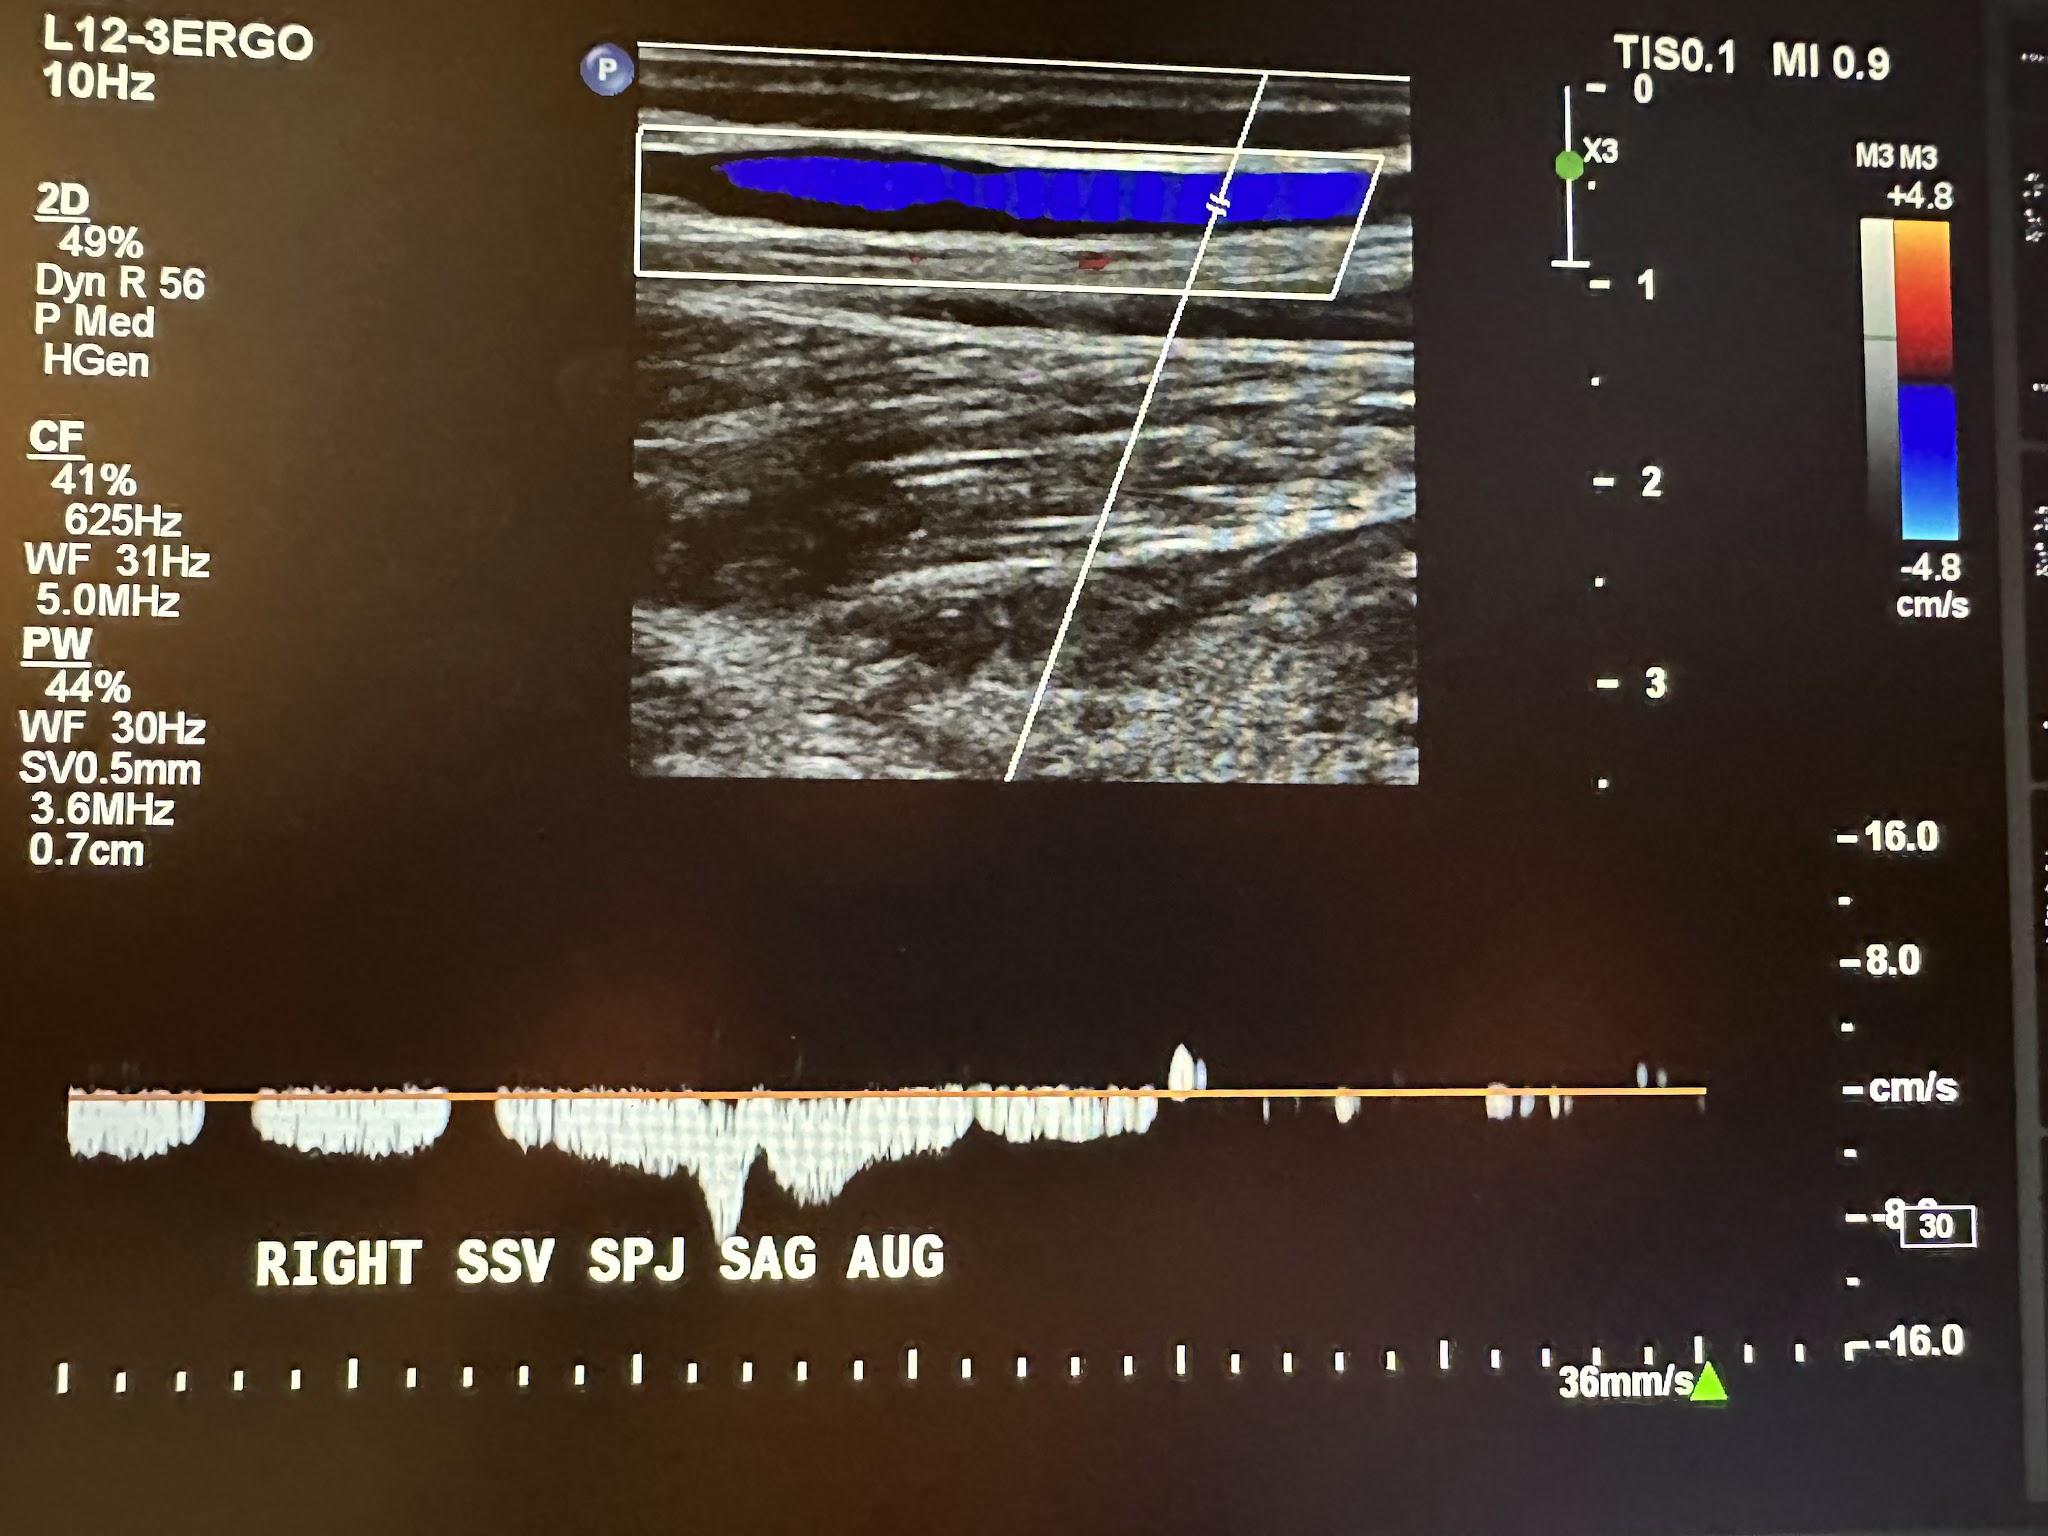
The next superficial vein to be evaluated is the SSV, starting in the popliteal area of the lower extremity and using the same approach as the great saphenous vein. We first start with a transverse image at the saphenopopliteal junction (SPJ) without color Doppler, followed by a sagittal image with augmentation with color Doppler. Figure 10-25 shows a side-by-side transverse ultrasound view of the right SSV at the SPJ, while Figure 10-26 represents the sagittal view of the right SSV at the SPJ with augmentation.
Also, anterior and posterior accessory saphenous veins are often evaluated as part of the superficial venous system, and perforating veins that connect superficial to deep veins are often evaluated during the study.
The template shown in the next couple of pages can be used to perform a complete venous duplex Doppler ultrasound examination of the lower extremities.
Date ________________ U/S technician _________________ Physician _______________
Complaint ____________________________ Comparative study ___________________

DEEP VENOUS SYSTEM

SUPERFICIAL VENOUS SYSTEM

Describe significant perforating veins, including size, location, and reflux: ______________________________________________________________________________________________________________________________________________________________________________________________________________________________________________________________________________________________________________________________________________________________________________
10.4 The Arterial System
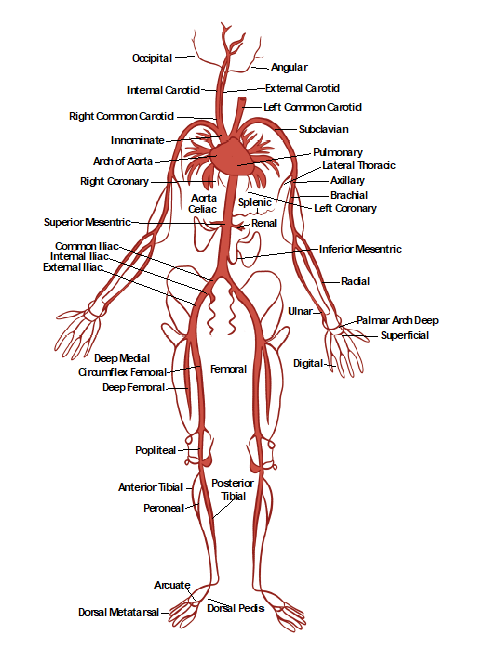
Figure 10-27 shows the anatomy of the arterial system, which will be helpful in discussing and understanding various ultrasonography images of the arteries.
10.4.1 Transcranial Doppler
Norwegian physicist Rune Aaslid developed intracranial ultrasound in 1982. Transcranial imaging was subsequently developed by a German neurologist, Ulrich Bogdahn, in 1990. It was the first noninvasive way to evaluate the circle of Willis using a low-frequency transducer (2 MHz).[5],[6]
Transcranial Doppler (TCD) can detect intracranial stenosis, vasospasm secondary to subarachnoid hemorrhage, and arteriovenous malformations and assess suspected brain death. A TCD system usually has a 2 MHz pulsed Doppler with a spectrum analyzer. A typical TCD probe is shown in Figure 10-28. Blood flow in TCD is usually measured in cm/sec, and Figure 10-29 represents a TCD velocity distribution. When evaluating intracranial vessels, it is vital to know the acoustic window, depth, direction of blood flow, velocity, and angle of insonation. One important principle when evaluating pathology is the pulsatility index (PI).

A high PI (>1.2) can indicate increased intracranial pressure, microvascular disease, or distal vasospasm. Also, a low PI (<0.8) can be seen with carotid stenosis or occlusion as well as arteriovenous malformations.[7],[8]

The three most common acoustic windows that provide direction to evaluate the intracranial vessels are the transtemporal, transorbital, and transforaminal windows, as shown in Figure 10-30. The transcranial evaluation begins with the transtemporal approach on each side to identify the anterior, middle, and posterior cerebral arteries, and sometimes, the most distal aspect of the internal carotid artery (ICA) may also be evaluated.[9],[10]
When evaluating the anterior cerebral artery, normal flow is away from the probe, the depth is 60–70 mm, and the velocity ranges from 41–76 cm/sec. The middle cerebral artery has normal flow toward the probe, a depth of 30–60 mm, and a velocity that ranges from 46–86 cm/sec. The posterior cerebral artery typically has flow toward the probe, a depth of 60–70 mm, and a velocity range of 33–64 cm/sec, as shown in Figure 10-31.[11],[12],[13]

The transorbital approach is followed and used to evaluate the ophthalmic artery and carotid siphon on each side, as shown in Figure 10-32. The location for of obtaining flow patterns is essential in this window, since it is difficult to determine the anatomic structure, as in the transtemporal approach demonstrating the circle of Willis. Comparisons can be made between different flow patterns.

The transforaminal approach is then used to evaluate the intracranial vertebral arteries and the basilar arteries, as shown in Figure 10-33.

In the vertebral arteries, normal blood flow is away from the probe, the depth is 60–70 mm, and the velocity ranges from 27–55 cm/sec. In the basilar arteries, normal blood flow is away from the probe, the depth is 80–120 mm, and the velocity is 30–57 cm/sec.
10.4.2 Sonography of the Carotid Arteries
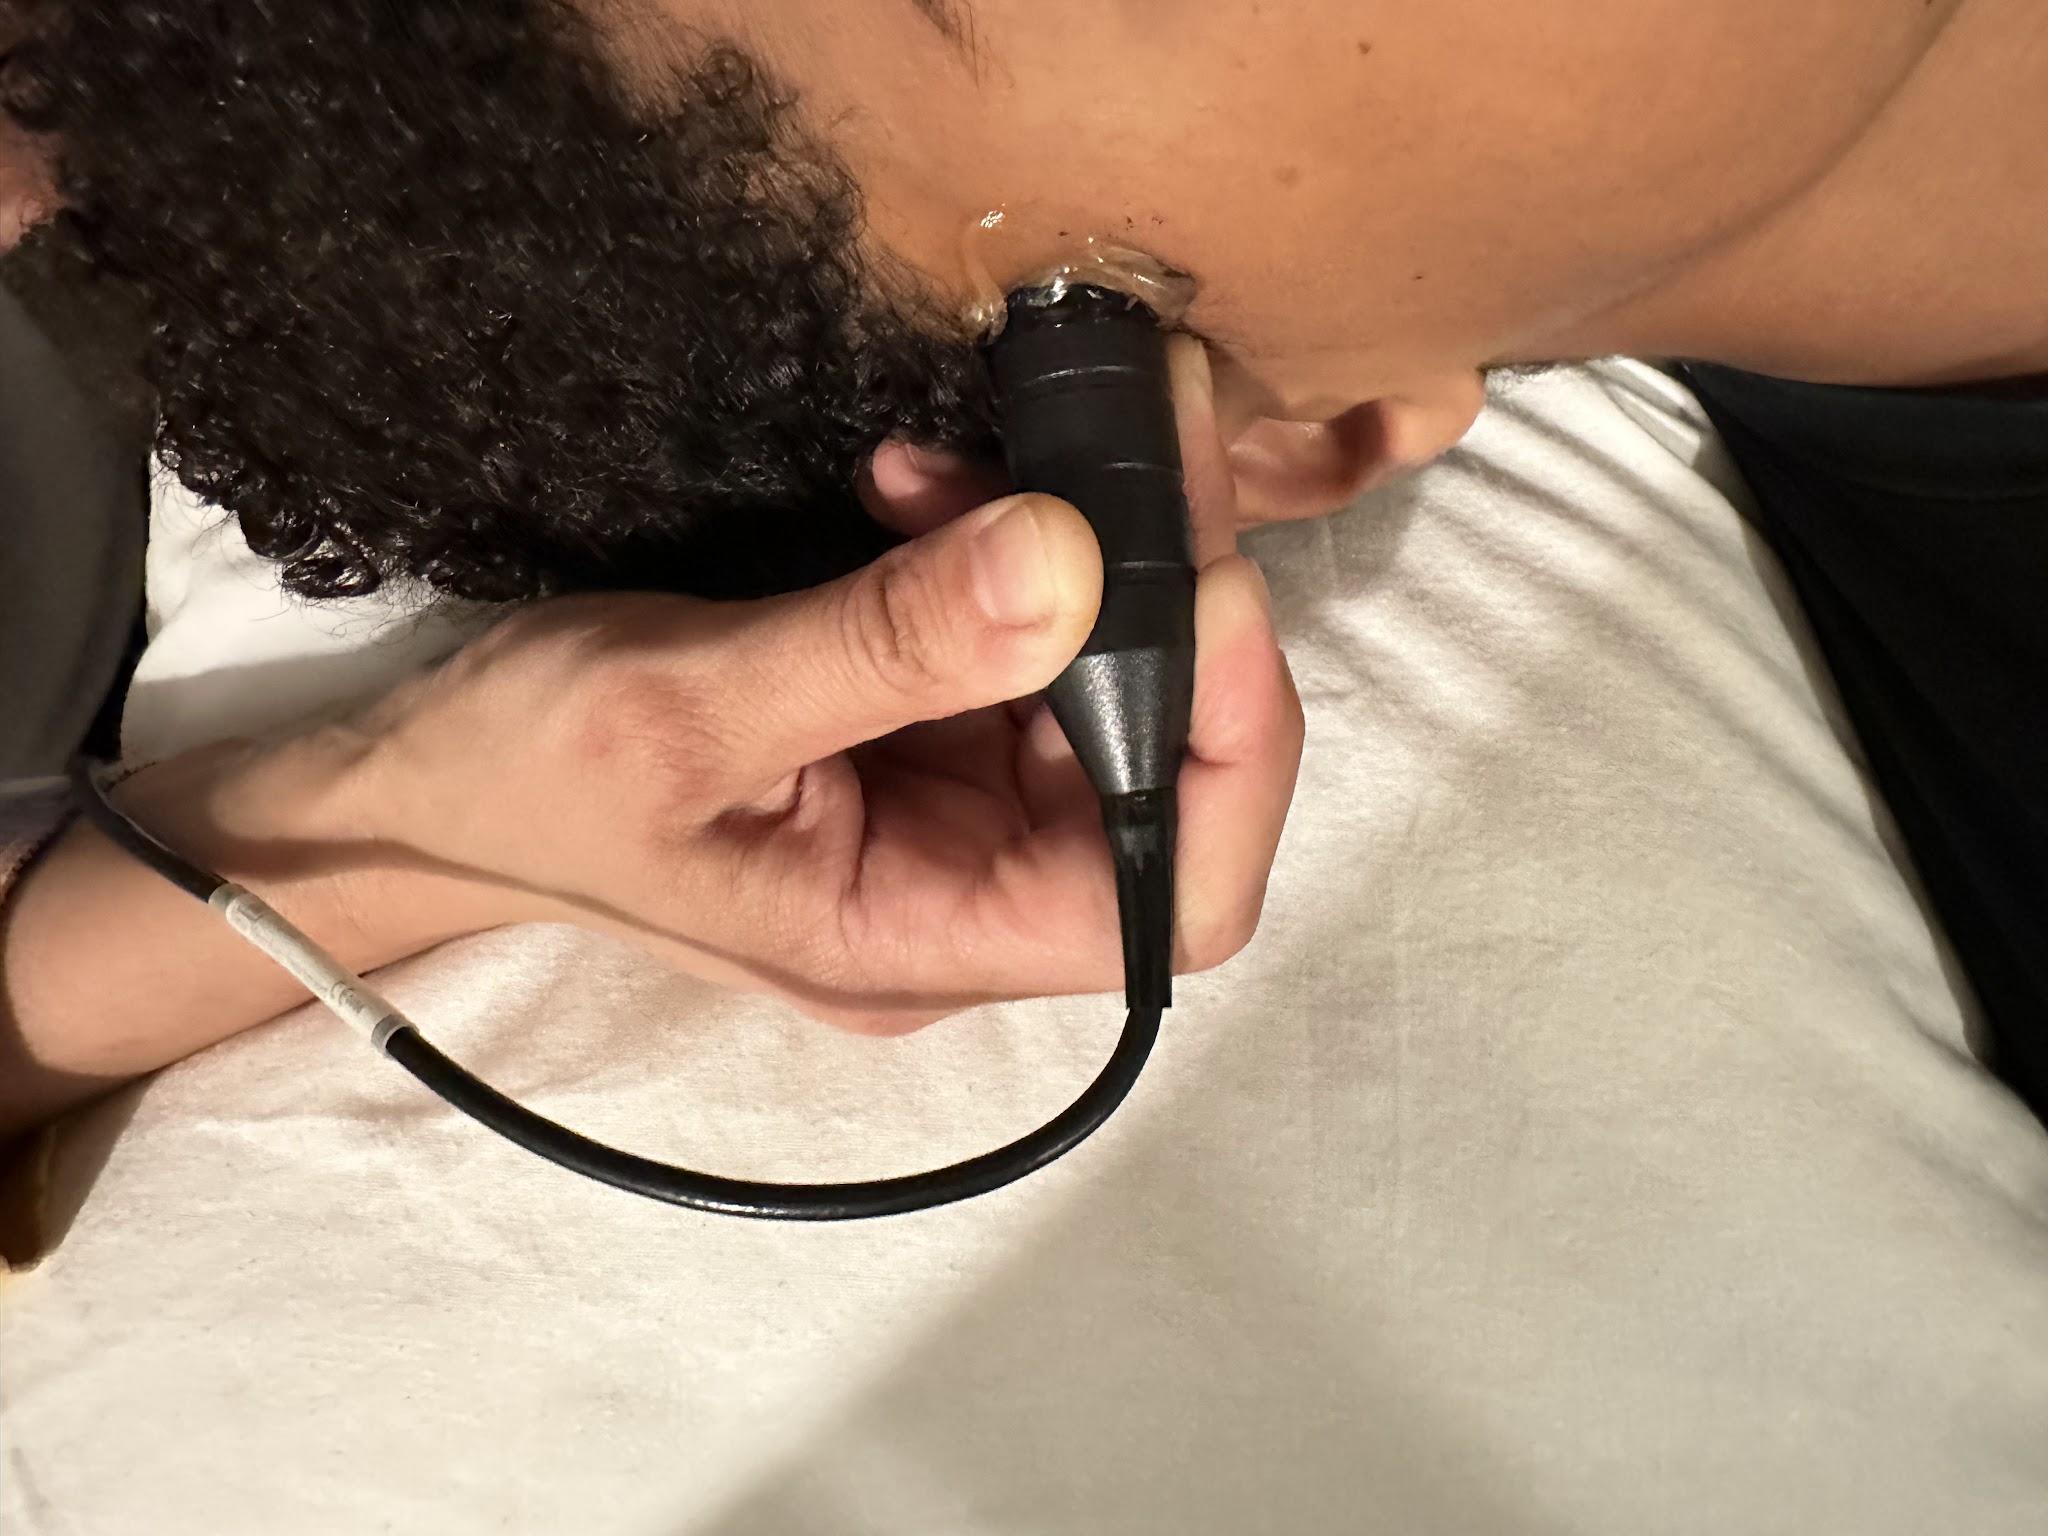
Figure 10-34 shows the positioning of the ultrasound probe for carotid artery evaluations. A high-frequency linear transducer (7.5–10 MHz) is most appropriate for carotid sonography. Transverse and longitudinal views are both imaged in B-mode, color, and spectral Doppler. In the sagittal plane, the ICA, external carotid artery (ECA), and right common carotid artery (CCA) are followed from the clavicle to the mandible with anterior, oblique, lateral, and posterior projections to identify plaque formation. Comparison flow characteristics are made from one side to the other as well as from proximal to distal segments of the ICA, ECA, and CCA.[14] In the transverse plane, the ICA and CCA are followed to evaluate plaque formations. The percentage of stenosis can then be evaluated by looking at the diameter reduction. Plaque characteristics can be evaluated for calcification, thrombosis, and fibrosis.
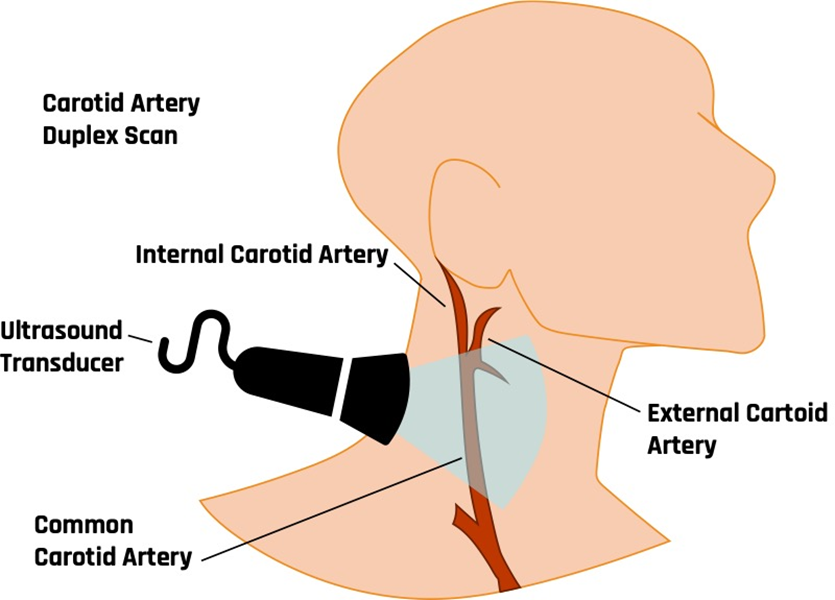
Figure 10-35 shows the CCA in the proximal transverse plane with the jugular vein on top, demonstrating blood flow in the opposite direction following the BART principle. Prox is the abbreviation used for proximal in the image for Figure 10-35 and some of the other following ones. Pulsed Doppler with spectral analysis is the primary tool for evaluating blood flow in the vascular study.
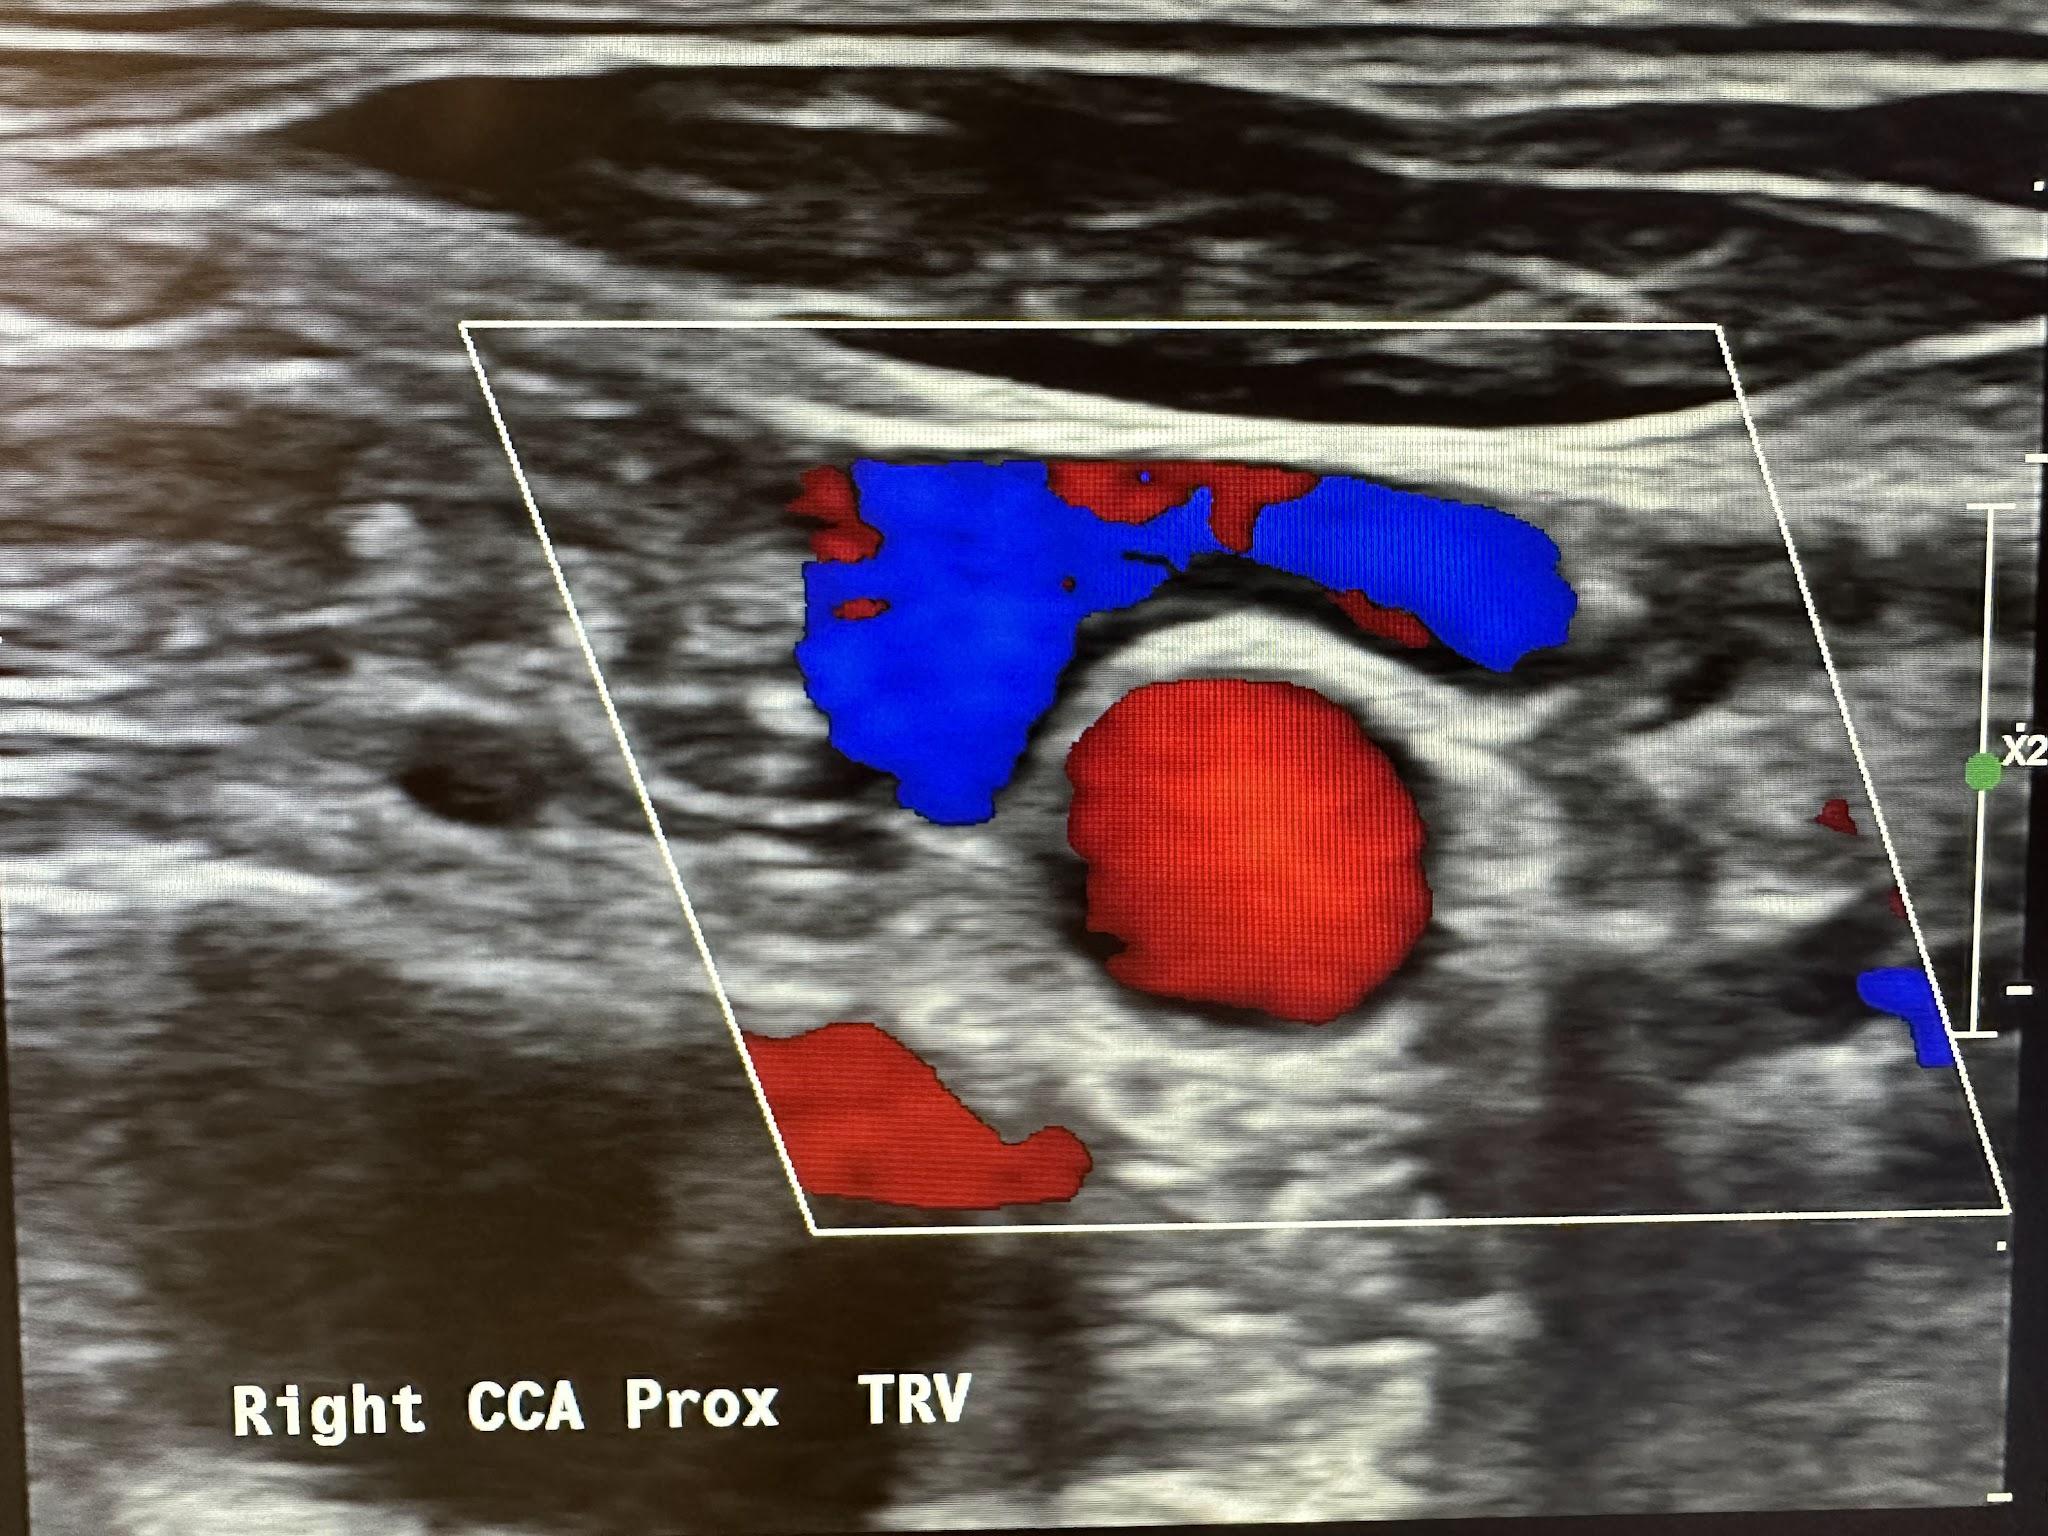
Figure 10-36 shows the pulsed wave (PW) Doppler with spectral analysis of the right CCA in the distal sagittal plane. Spectral analysis is a method of displaying the variety of frequencies of blood flow during systole and diastole. The scanner technology automatically analyzes and displays the individual frequencies of the returned signals, creating a velocity profile consisting of time on the horizontal axis, frequency shifts on the vertical axis, and amplitude as brightness. This combination of blood flow analysis and anatomic information is the basis of duplex ultrasonography,[15] as discussed in Chapter 2.
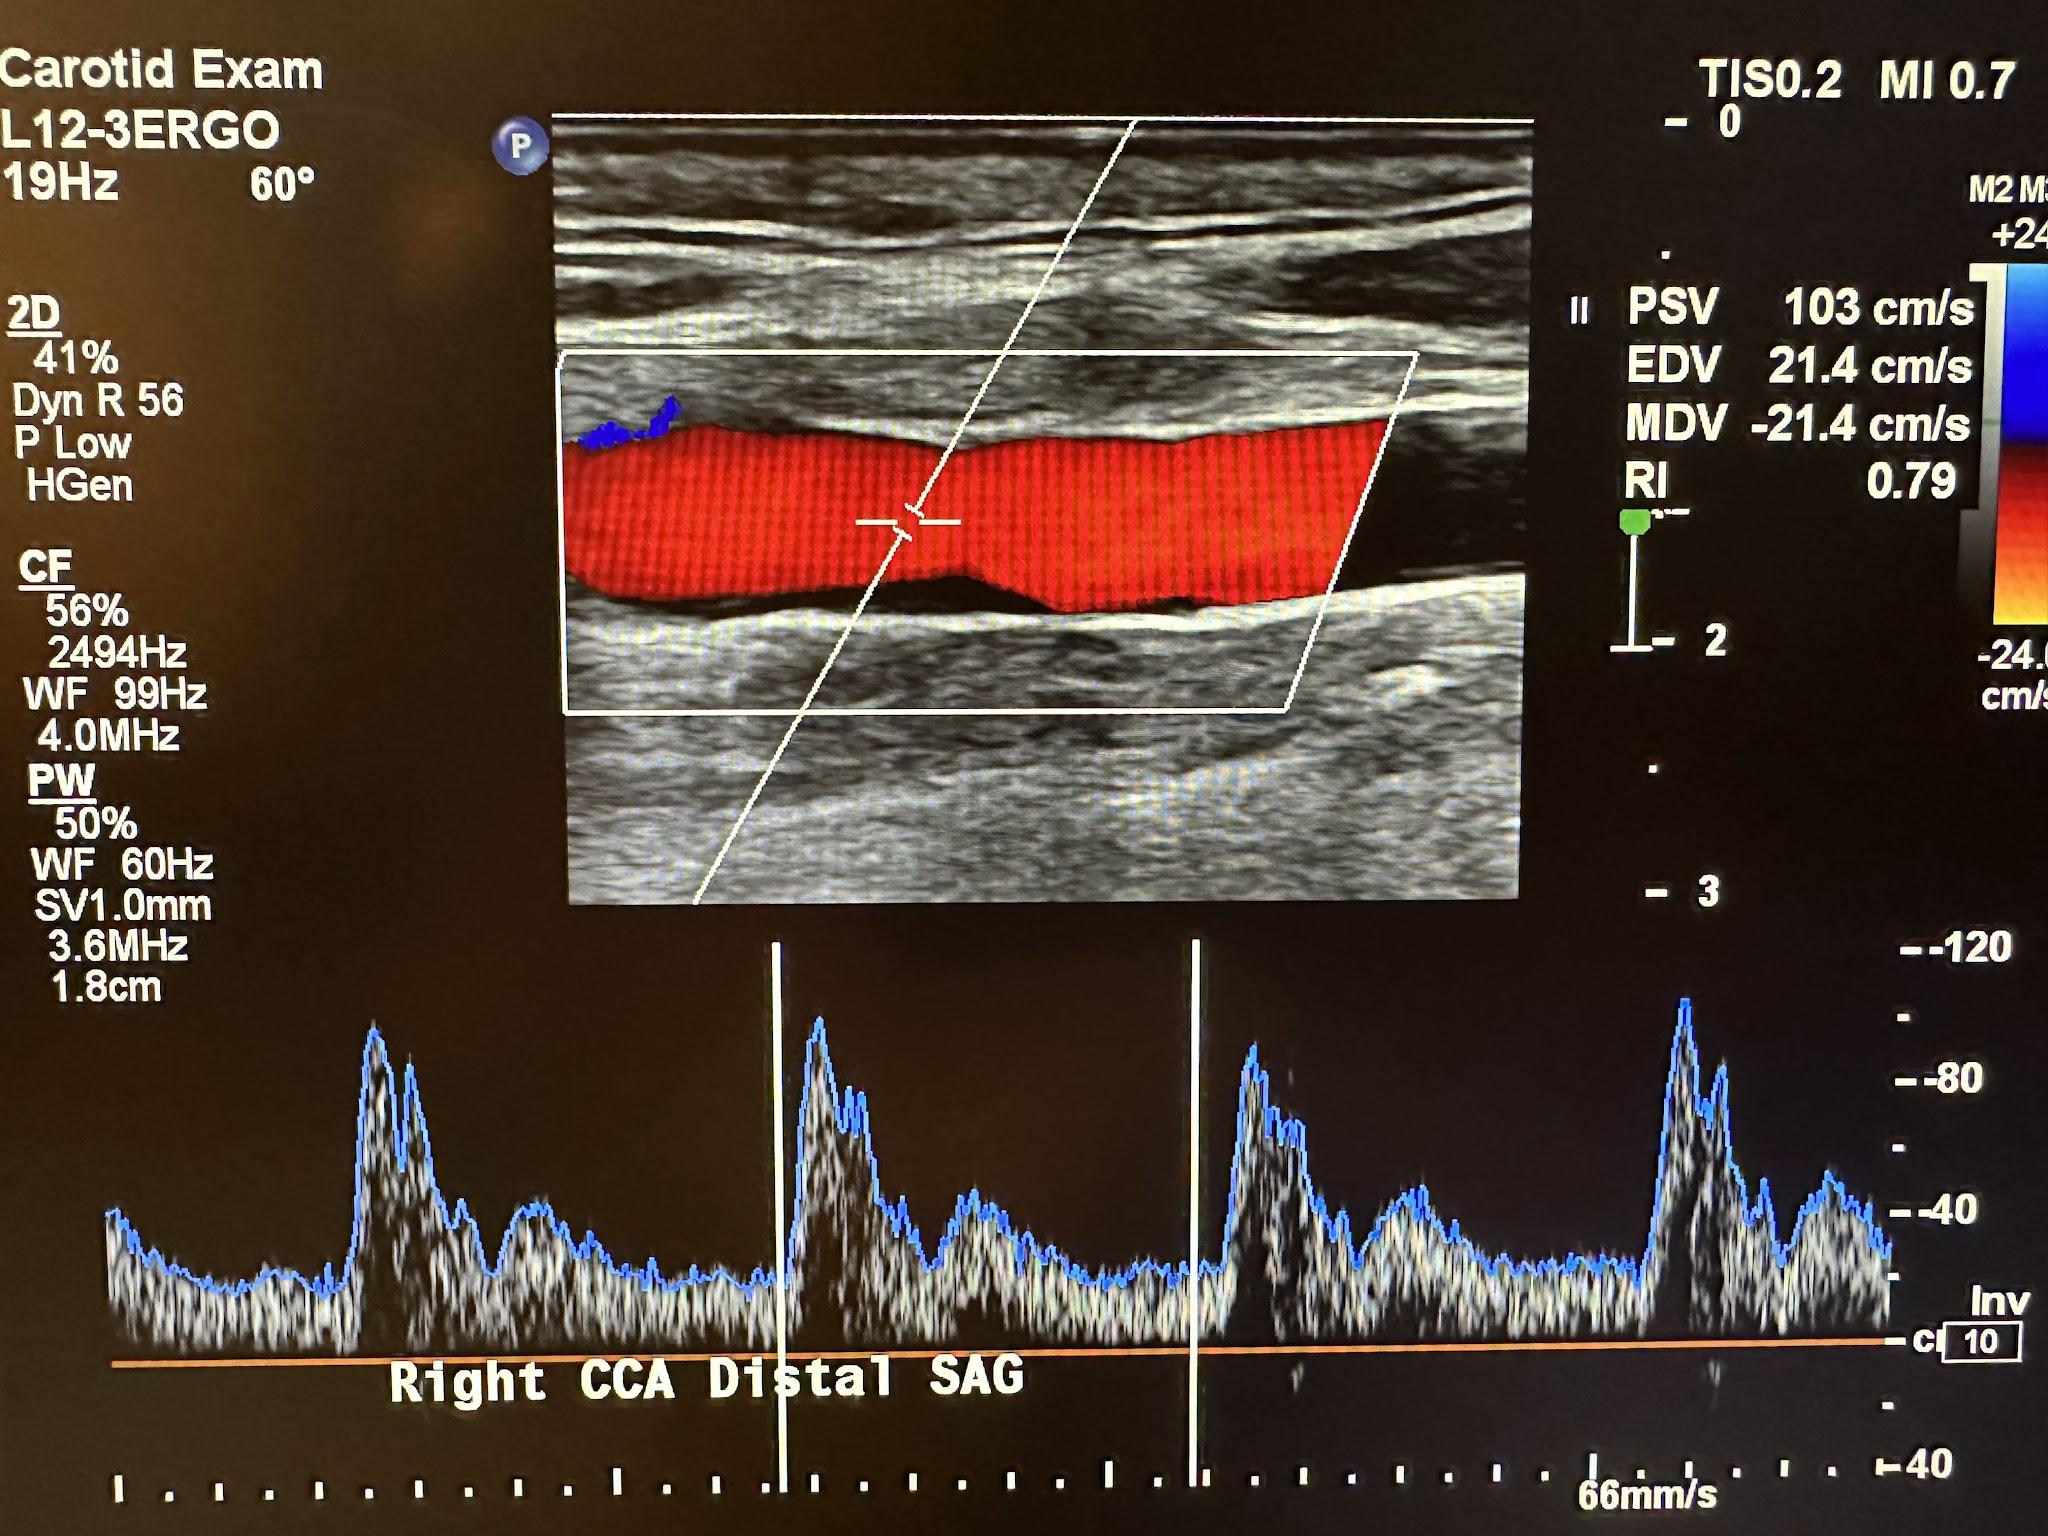
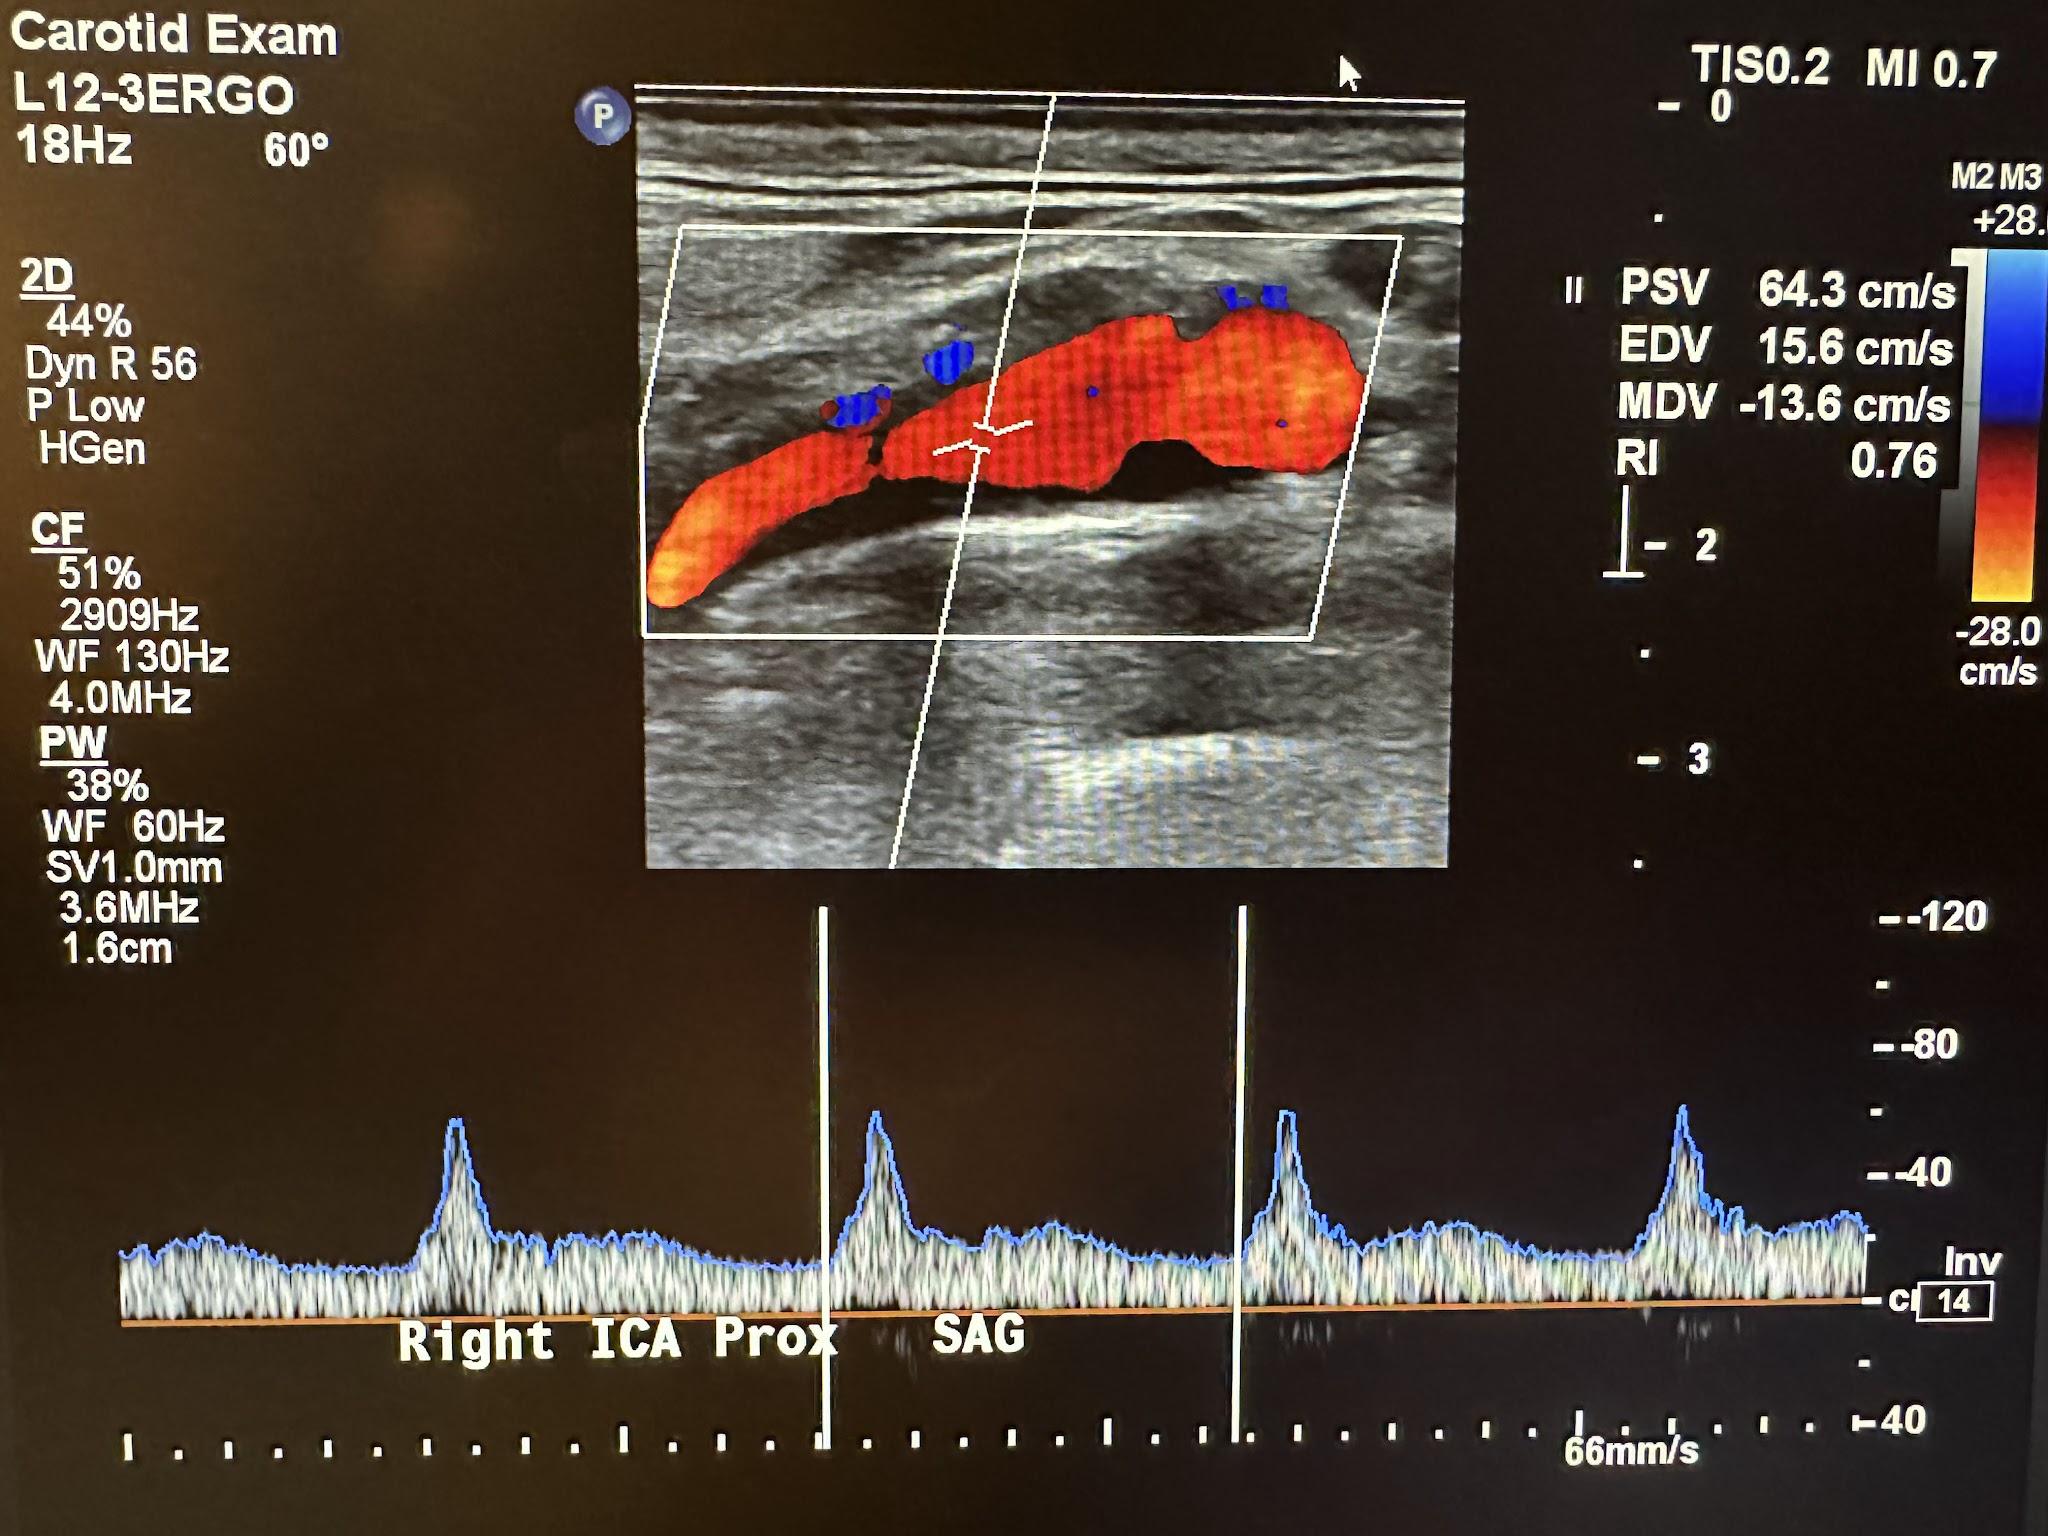
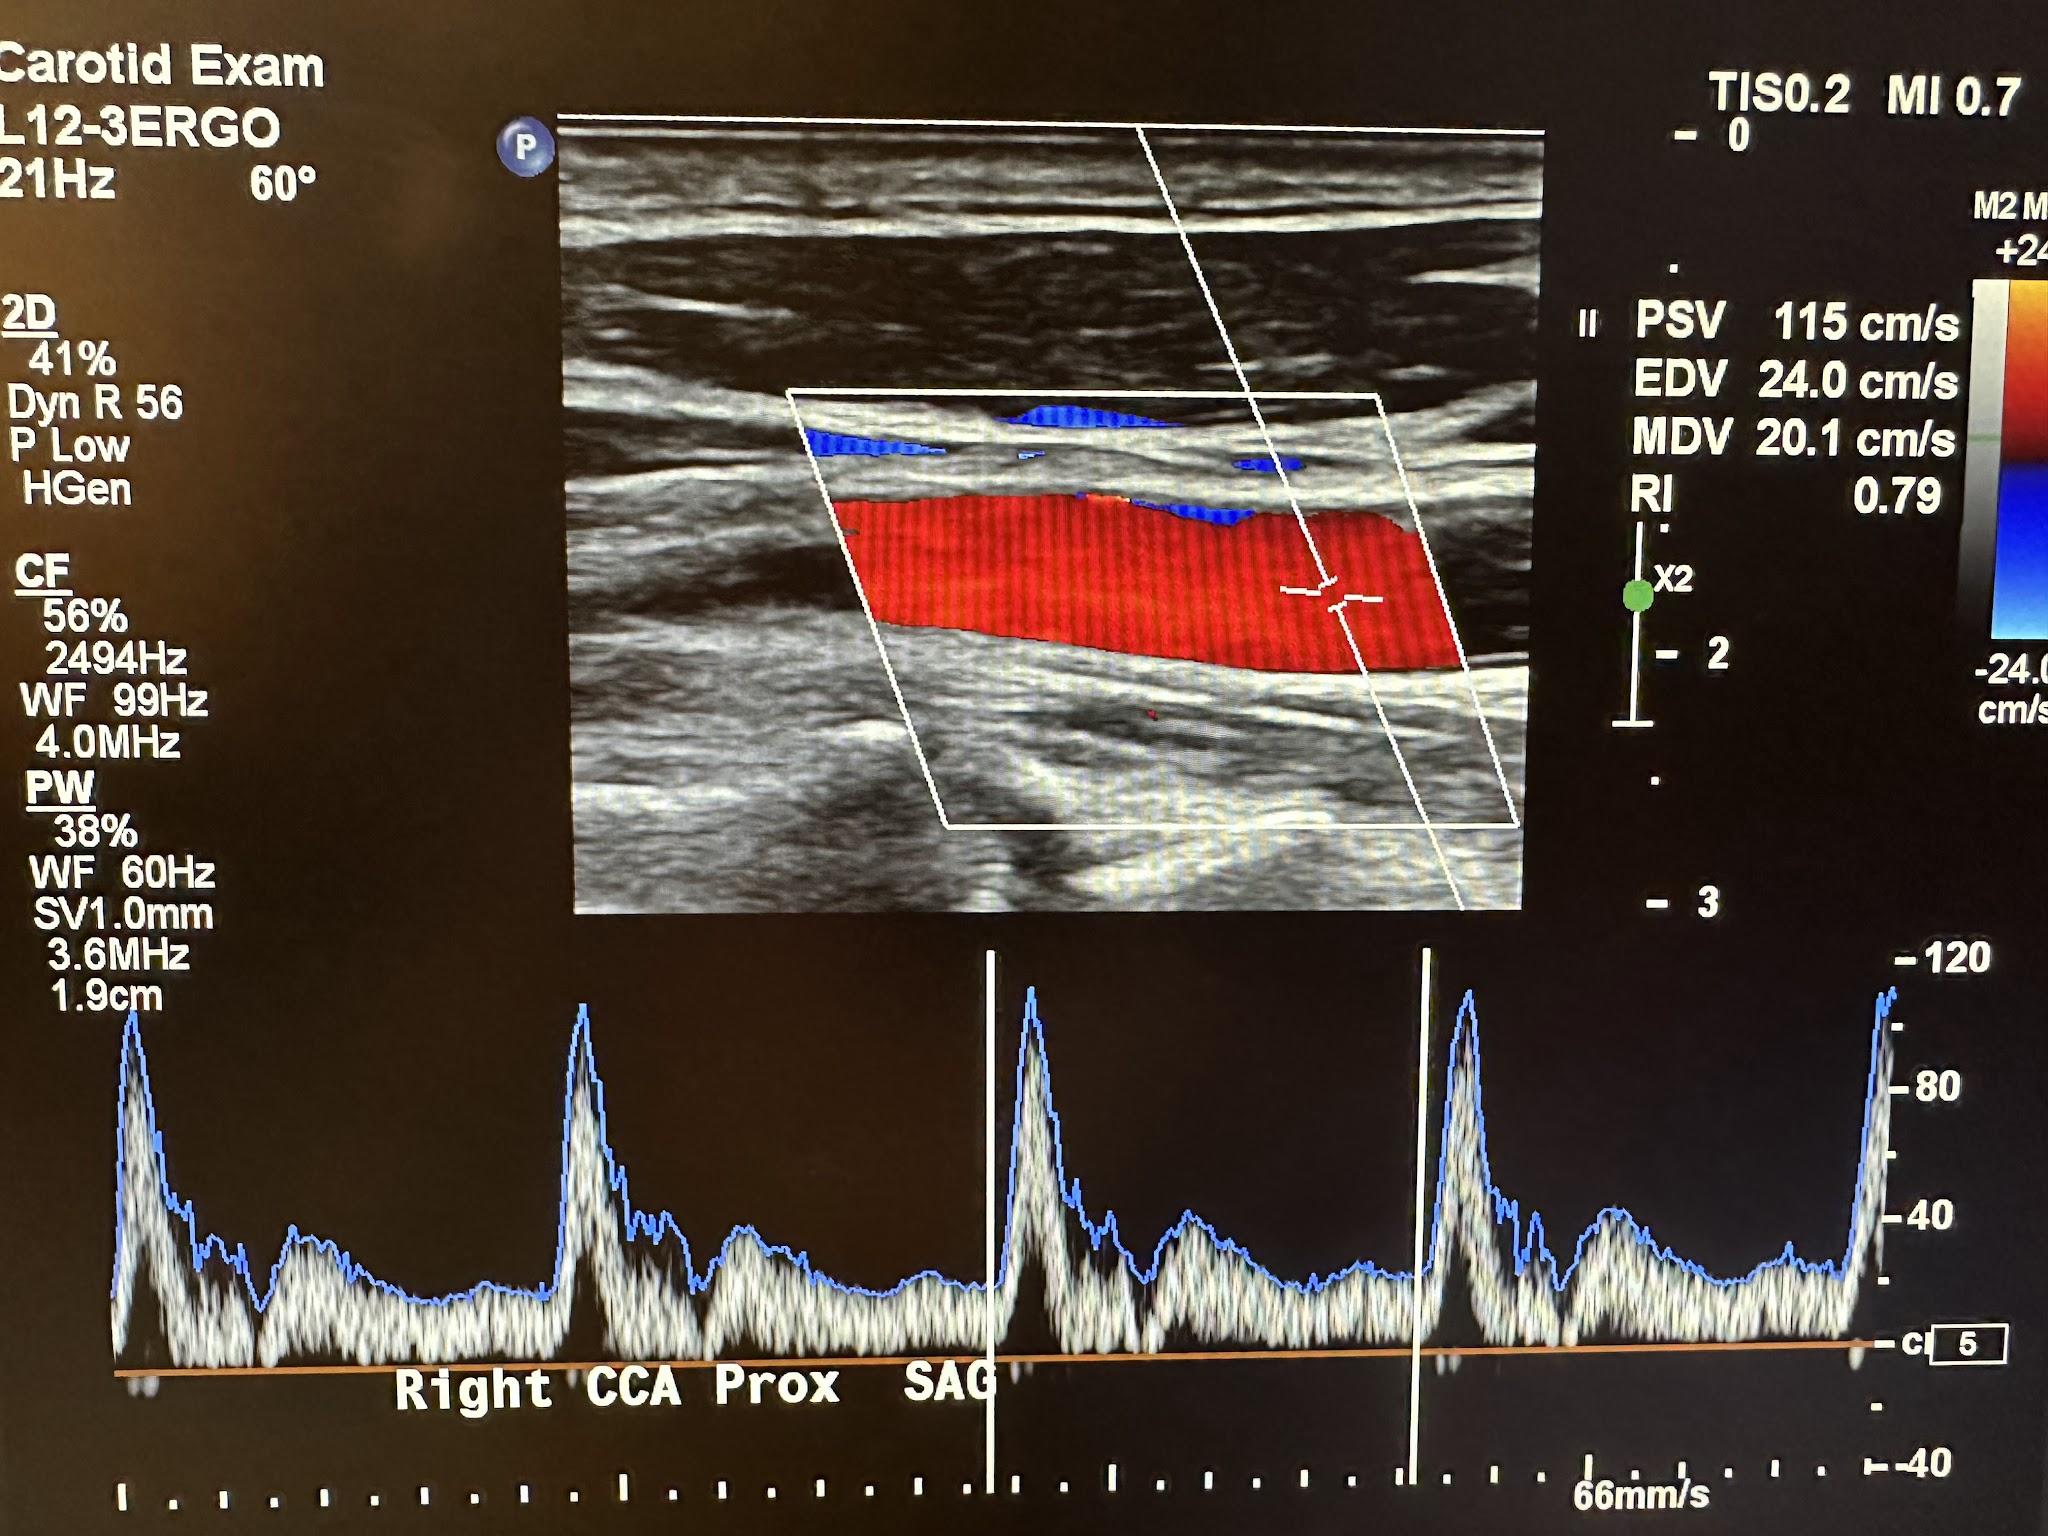
The Doppler characteristics of the carotid artery system are different. The ICA and CCA usually have low flow resistance, as shown in Figures 10-37 and 10-38, respectively. Flow occurs throughout the cardiac cycle. The diastolic segment does not touch the baseline. The ECA has high flow resistance with little or no diastolic or reversed diastolic flow. Reproducible and consistent velocity measurements require an angle of 60 degrees or less. Although a zero-degree angle of insonation provides the most remarkable Doppler shift because this depends on the angle’s cosine, this would be difficult with most vessels. The criteria used for the interpretation of velocity measurements were established using a 60-degree angle.[16],[17]
Since the brain is a low-resistance vascular bed, the ICA is less pulsatile with increased flow during diastole. The typical waveform of the ICA has a rapid upstroke during systole and a high diastolic component with a possible dicrotic notch and gradual downslope.
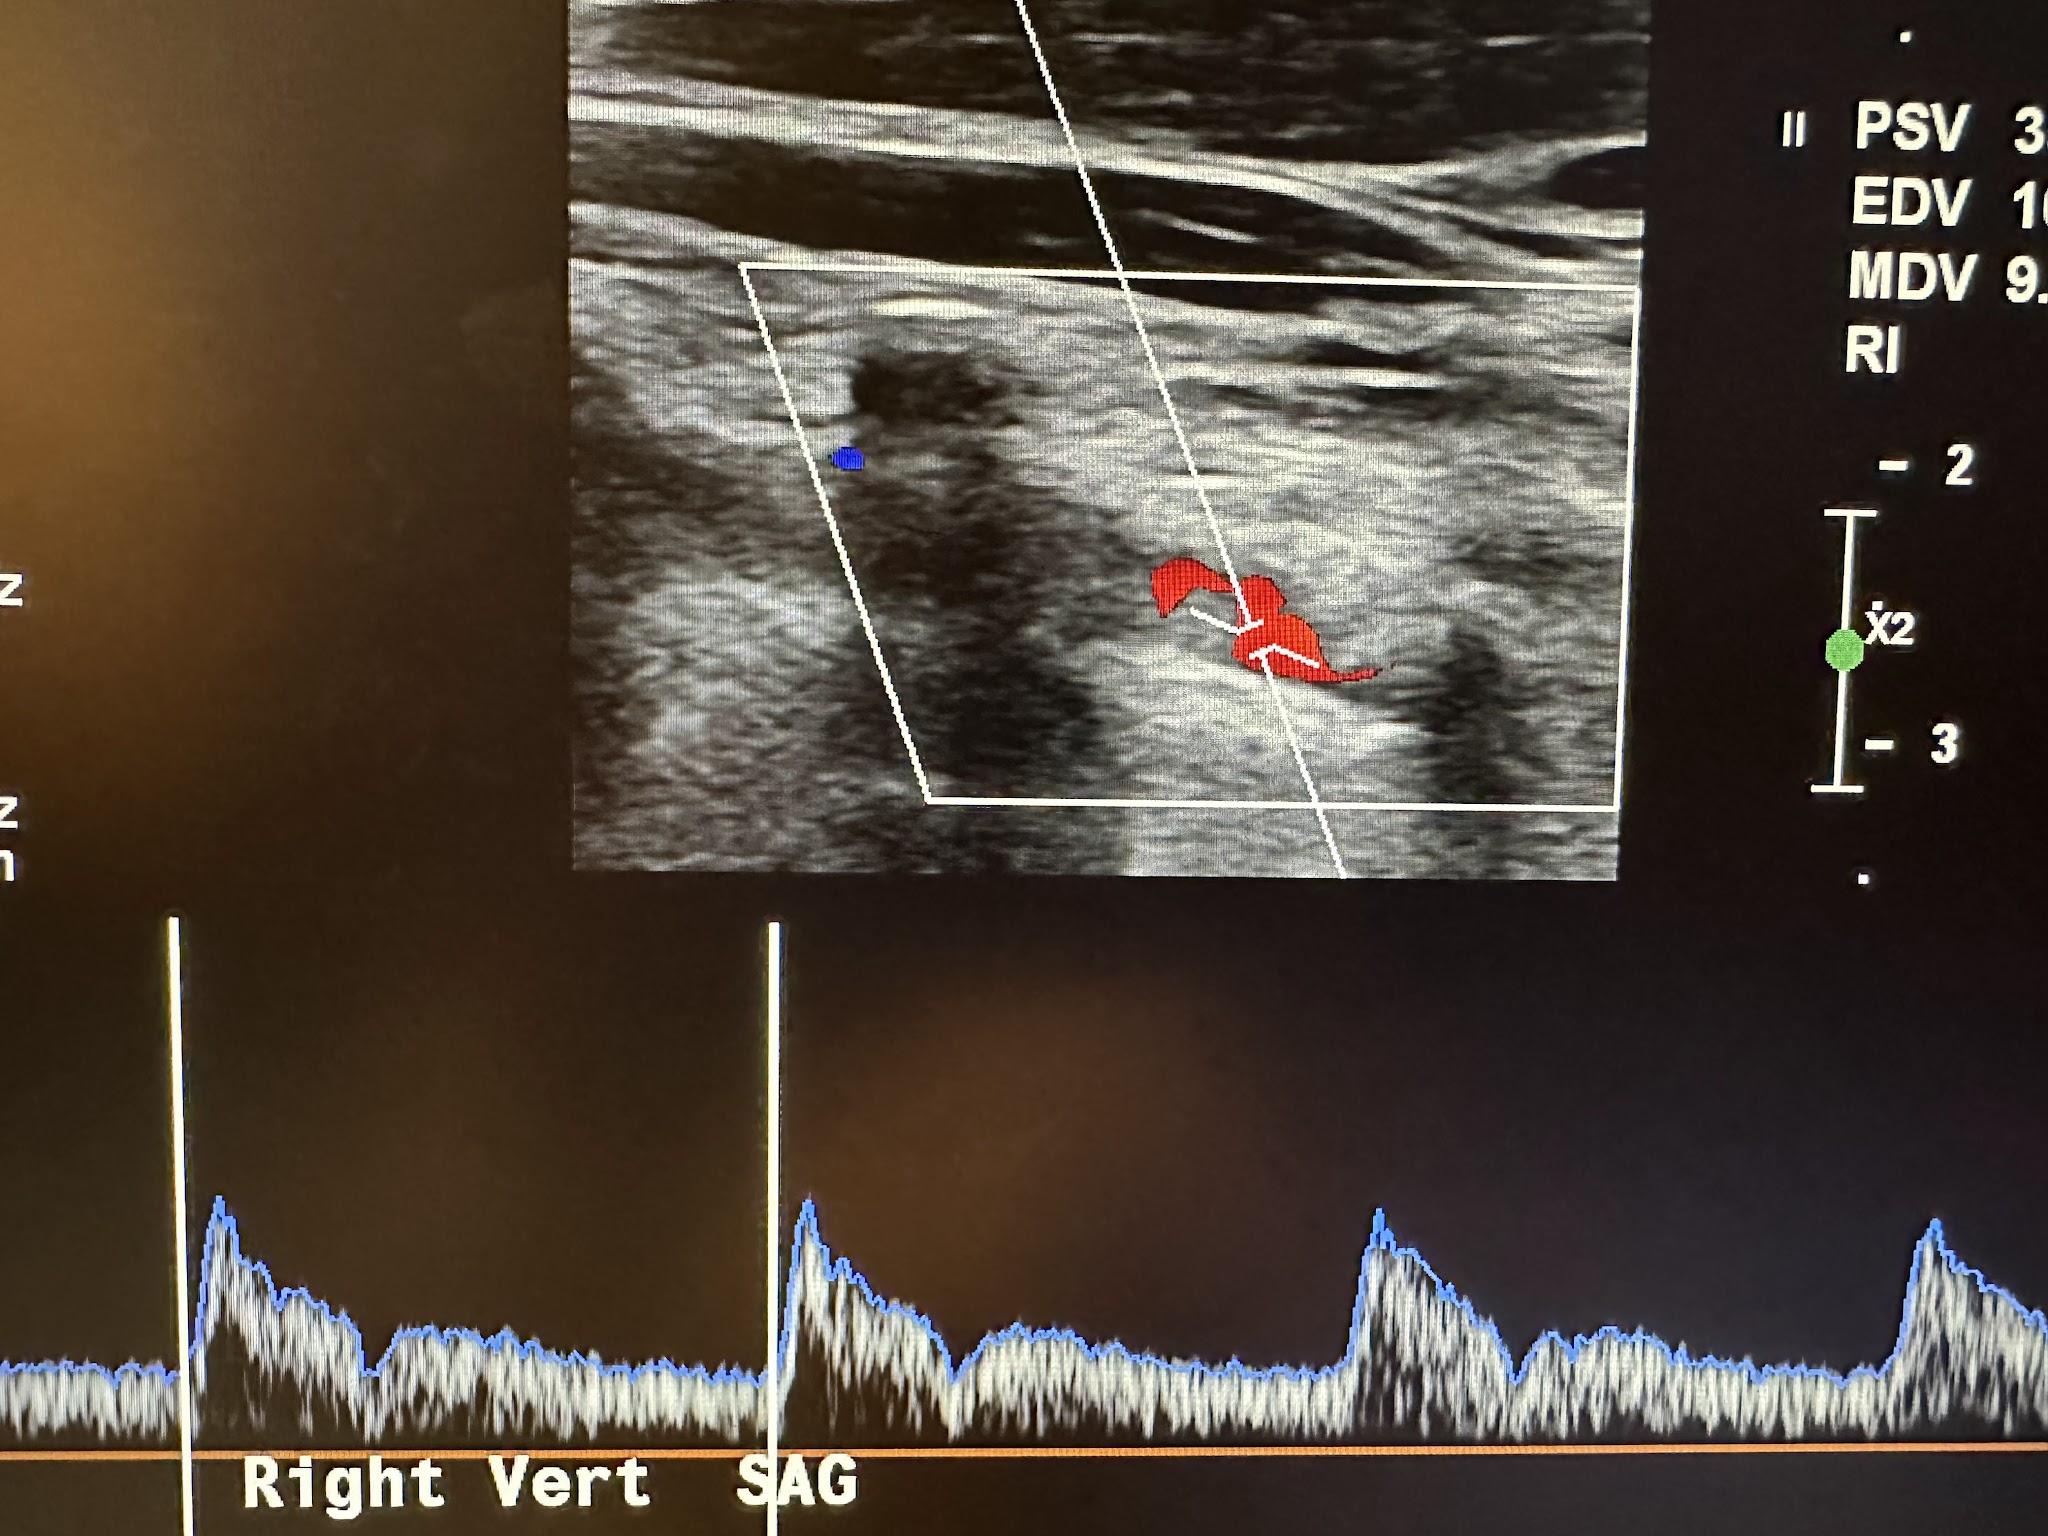
With the common carotid artery in the longitudinal plane, the transducer is angled more posterolaterally to identify the vertebral artery. Vertical shadows will appear running through the vertebral arteries, which are the transverse processes of the vertebrae, as shown in Figure 10-39. Vert in the image represents the vertebral artery. Flow direction is documented.
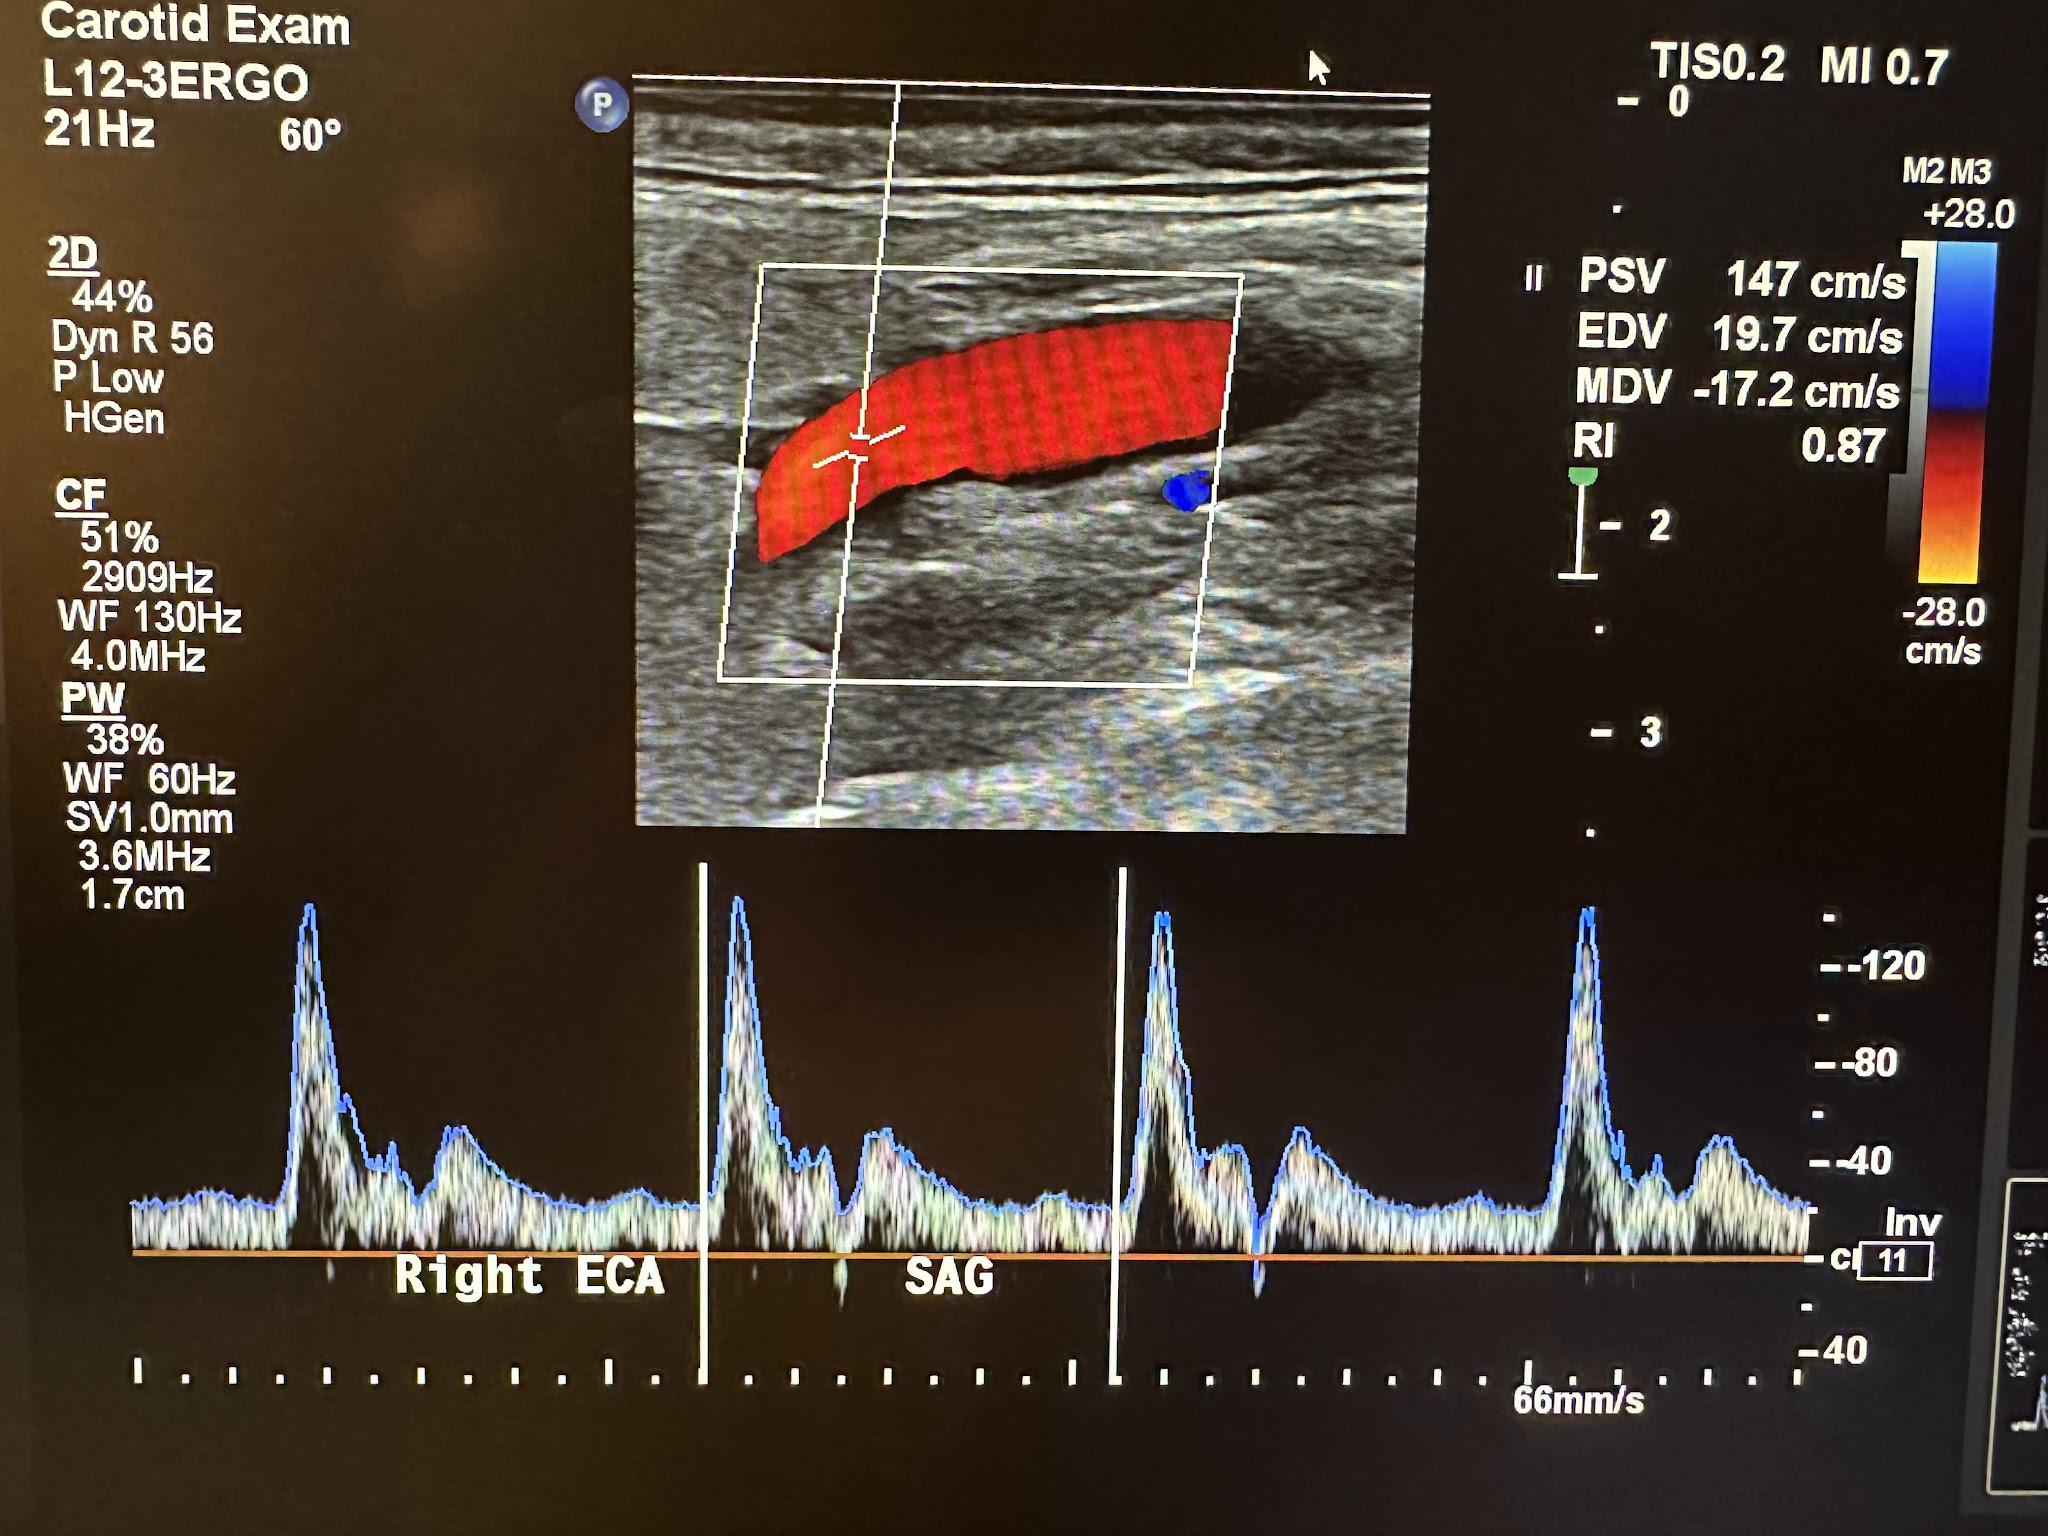
The ECA supplies blood to vascular areas with higher resistance, such as the scalp. It has a rapid upstroke in systole and rapid downstroke in diastole with a dicrotic notch, as shown in Figure 10-40.
Both the CCA and vertebral arteries have low flow resistance. The flow characteristics are similar to the ICA. Multiple guidelines and trials are used to determine the percentage of diameter stenosis and clinically relevant stenosis. The ICA is of the most importance for surgical intervention. The Society of Radiologists in Ultrasound Consensus, one of the most widely used guidelines to assess ICA stenosis, is presented in Table 10-1 the table below.[18]
Table 10-1: Criteria for assessing Internal Carotid Artery Stenosis.

The North American Symptomatic Endarterectomy Trial was published in the journal Stroke in 1991.[19] The results concluded that patients with 70–99% stenosis of the ICA benefit from surgical intervention in the appropriate clinical setting.
10.4.3 Sonography of the Aorta
The aorta is the largest artery in humans. It branches off the heart’s left ventricle into the thoracic and abdominal cavities, as shown in Figure 10-41. The abdominal aorta branches into the right and left iliac arteries at the level of the umbilicus, where it carries oxygenated blood to each lower extremity. When the wall of the aorta weakens and expands, an aneurysm develops (with an increased risk of rupture under this high-pressure system).

Each year, 200,000 people in the United States are diagnosed with an abdominal aortic aneurysm (AAA). Of these, nearly 7.5% have a life-threatening risk of rupture. The majority of patients with AAA are asymptomatic. The aorta’s diameter must be greater less than 3 cm to be diagnosed as an aneurysm. When it reaches 5 cm or greater, very close monitoring and surgical options are entertained. Risk factors for an AAA include hypertension, smoking, and genetic factors, especially involving immediate relatives with AAA. Men over the age of 60 are also at greater risk.[20]
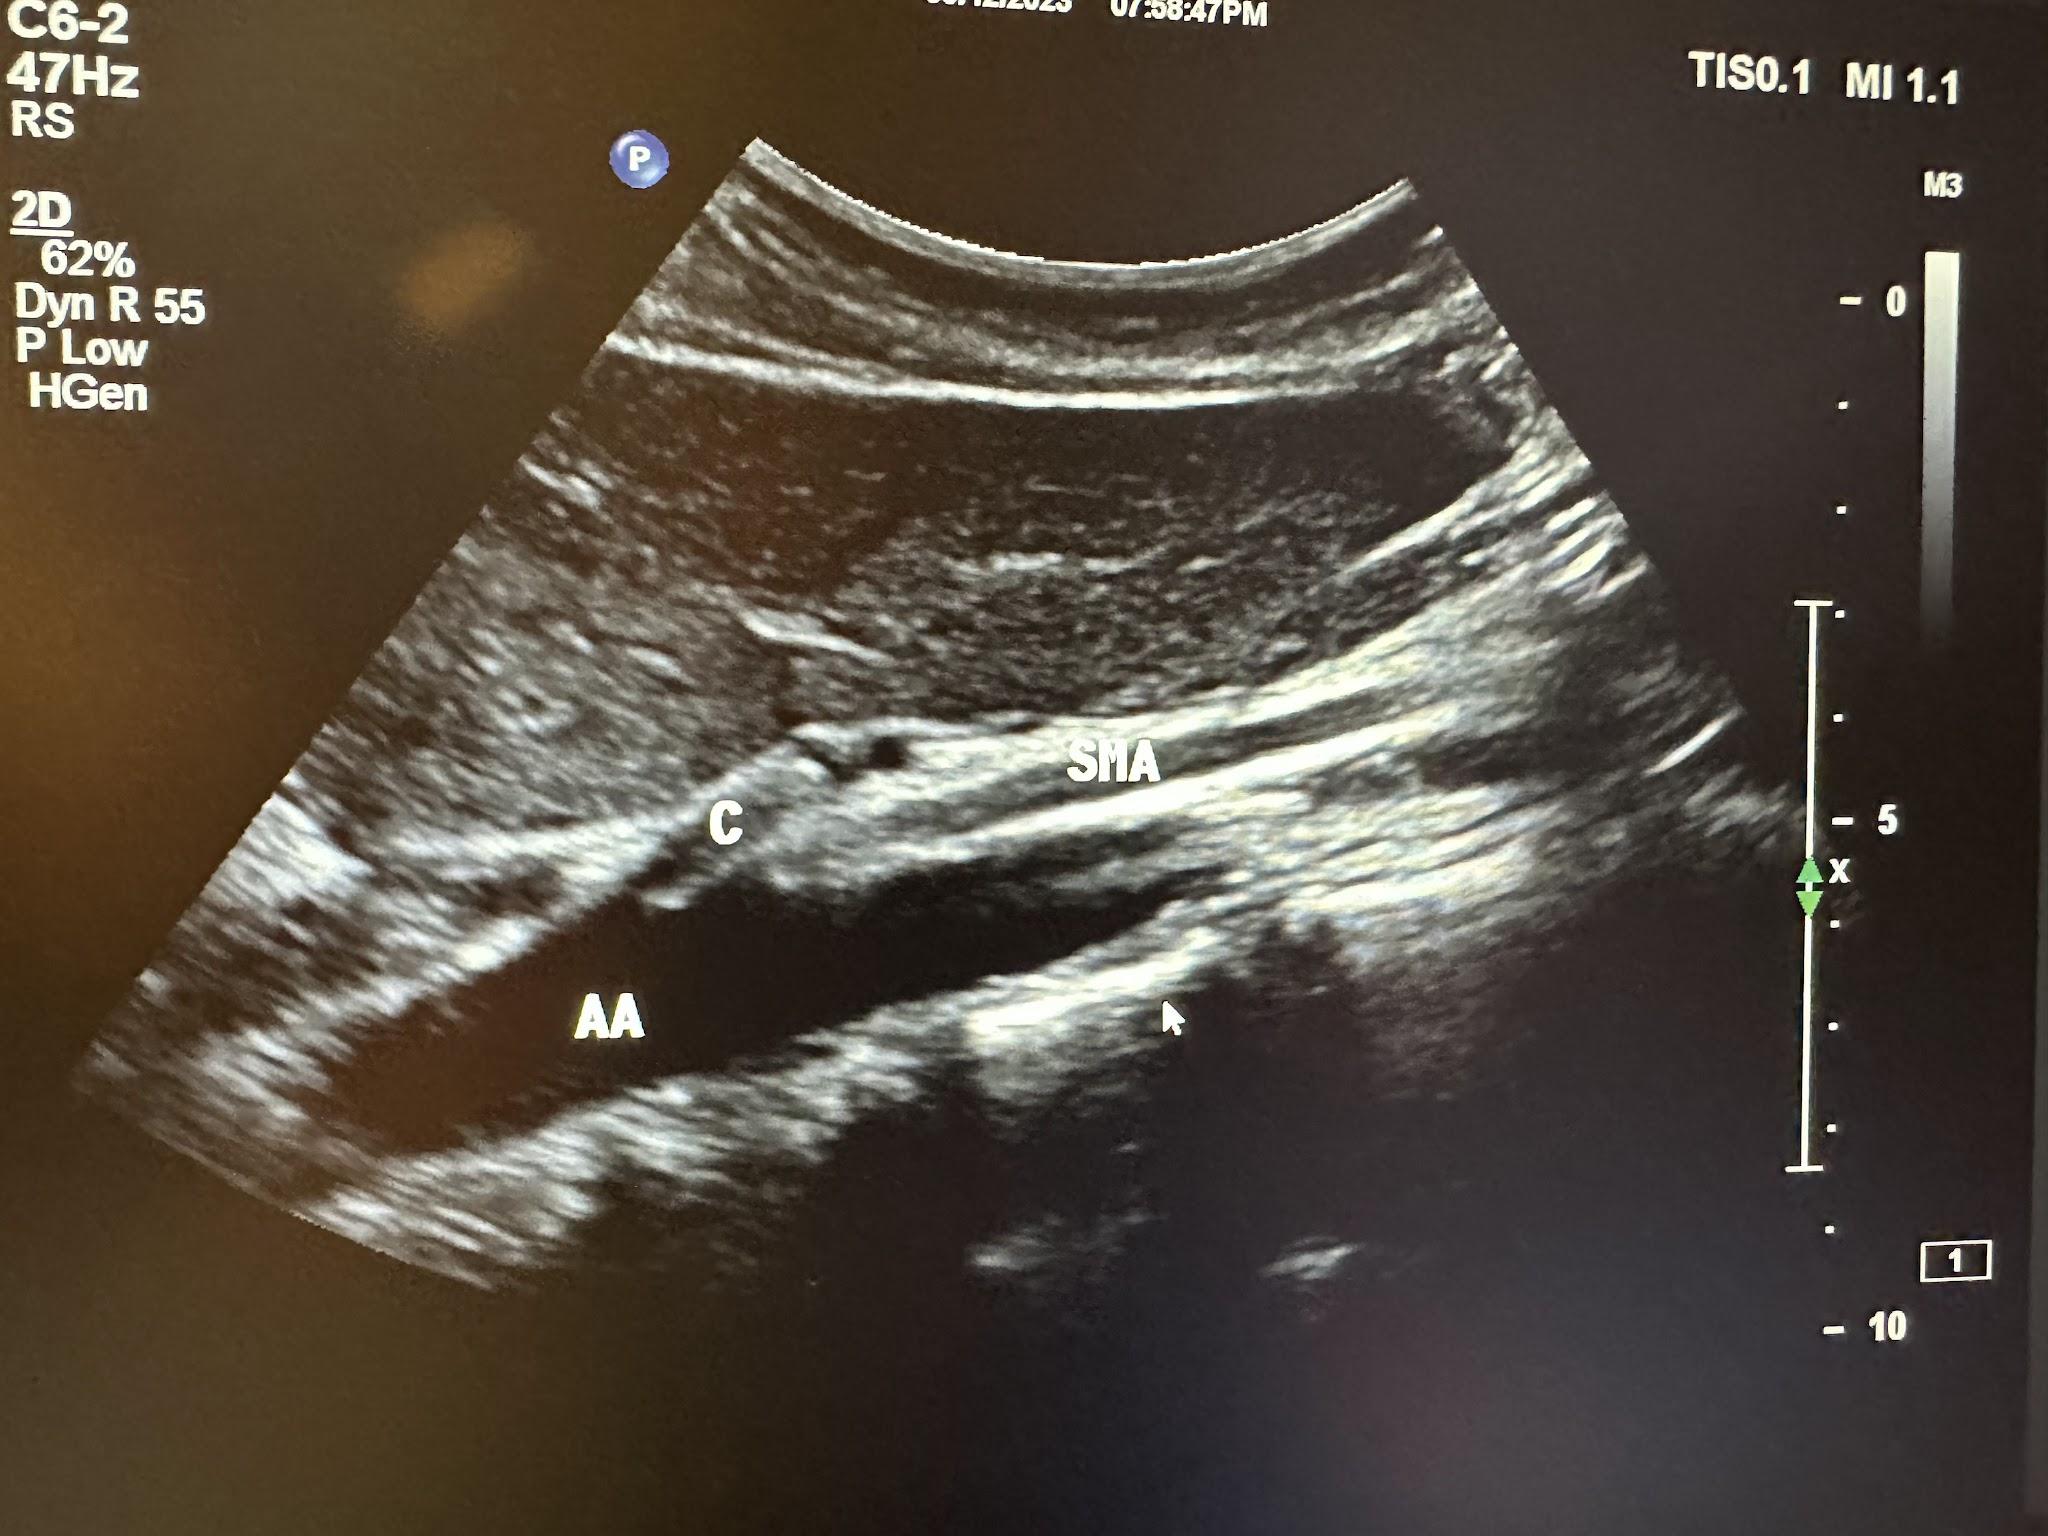
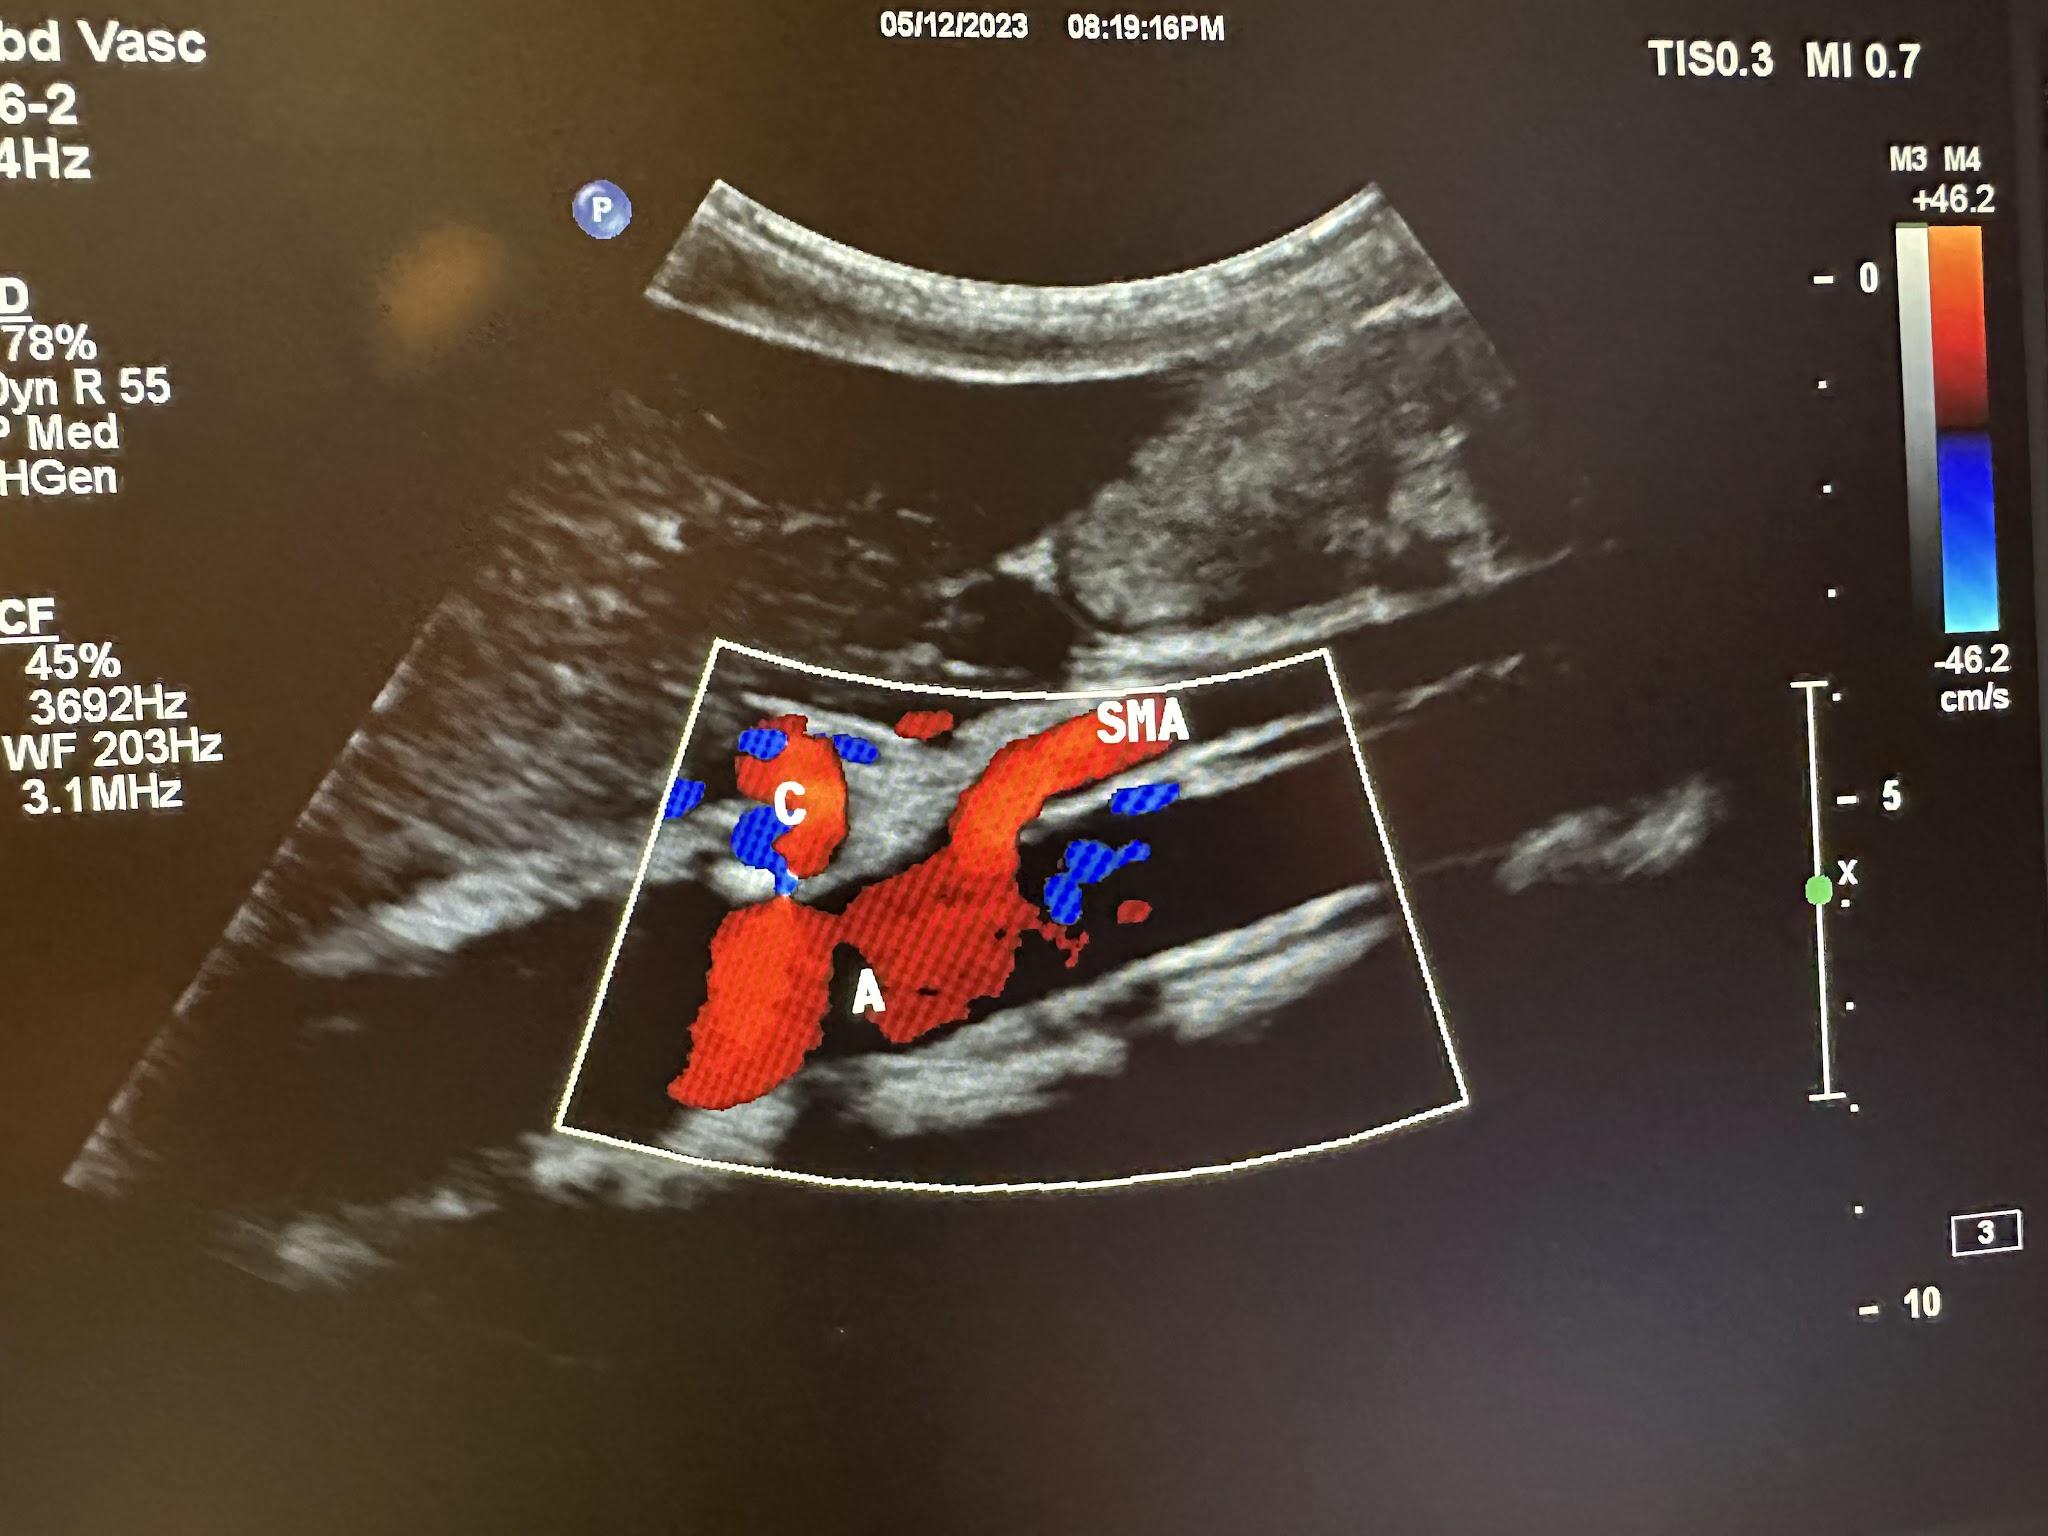
The ultrasound evaluation of the abdominal aorta (A or AA) should include the proximal, mid, and distal aorta to the bifurcation in the transverse and longitudinal planes, as shown in Figure 10-42. Evaluation of the branches of the aorta should include the celiac artery (C), superior mesenteric artery (SMA), and renal artery branches, as shown in Figures 10-43 and 10-44, without and with color Doppler, respectively.[21] The abbreviations given in parentheses in this paragraph have been labeled in some of the ultrasound images discussed below.

10.5 Arterial Sonography of the Lower Extremities
Figure 10-45 shows the normal anatomical branches of the arterial system in the lower extremity. Peripheral artery disease (PAD) is a condition in which the arteries of the lower extremities are narrowed primarily from atherosclerosis. Approximately 8 million people in the United States have PAD. Men and women are affected equally. Risk factors include smoking, diabetes, hypertension, high cholesterol, and being over 60 years of age. A classic symptom of PAD is claudication, or pain when walking. Lower-extremity arterial duplex scanning is a noninvasive way to identify the presence and severity of arterial occlusive disease.

It can also be used to follow the progression of the disease. The patient must rest for at least 20 minutes before testing, since this can affect the results, especially if the patient has PAD. The patient is then positioned supine with the lower extremities at the heart level so the hydrostatic pressure cannot falsely elevate the measurements.
During an arterial Doppler exam, various cuffs are placed on the patient’s legs and arms. This exam uses color wave (CW) Doppler. CW Doppler employs two crystals contained in the same probe: one that transmits the signal and one that receives the reflected sound wave of the blood cells. The reflected frequency is either higher or lower than the transmitted frequency, depending on the flow direction. This change in frequency is called the Doppler shift. The ankle brachial index (ABI) is recorded, and the waveforms are analyzed. The ABI is a simple test that compares the blood pressure in the upper and lower limbs. The ABI is calculated by dividing the blood pressure in an ankle artery by the blood pressure in an arm artery. An ABI value of less than 0.9 indicates PAD.
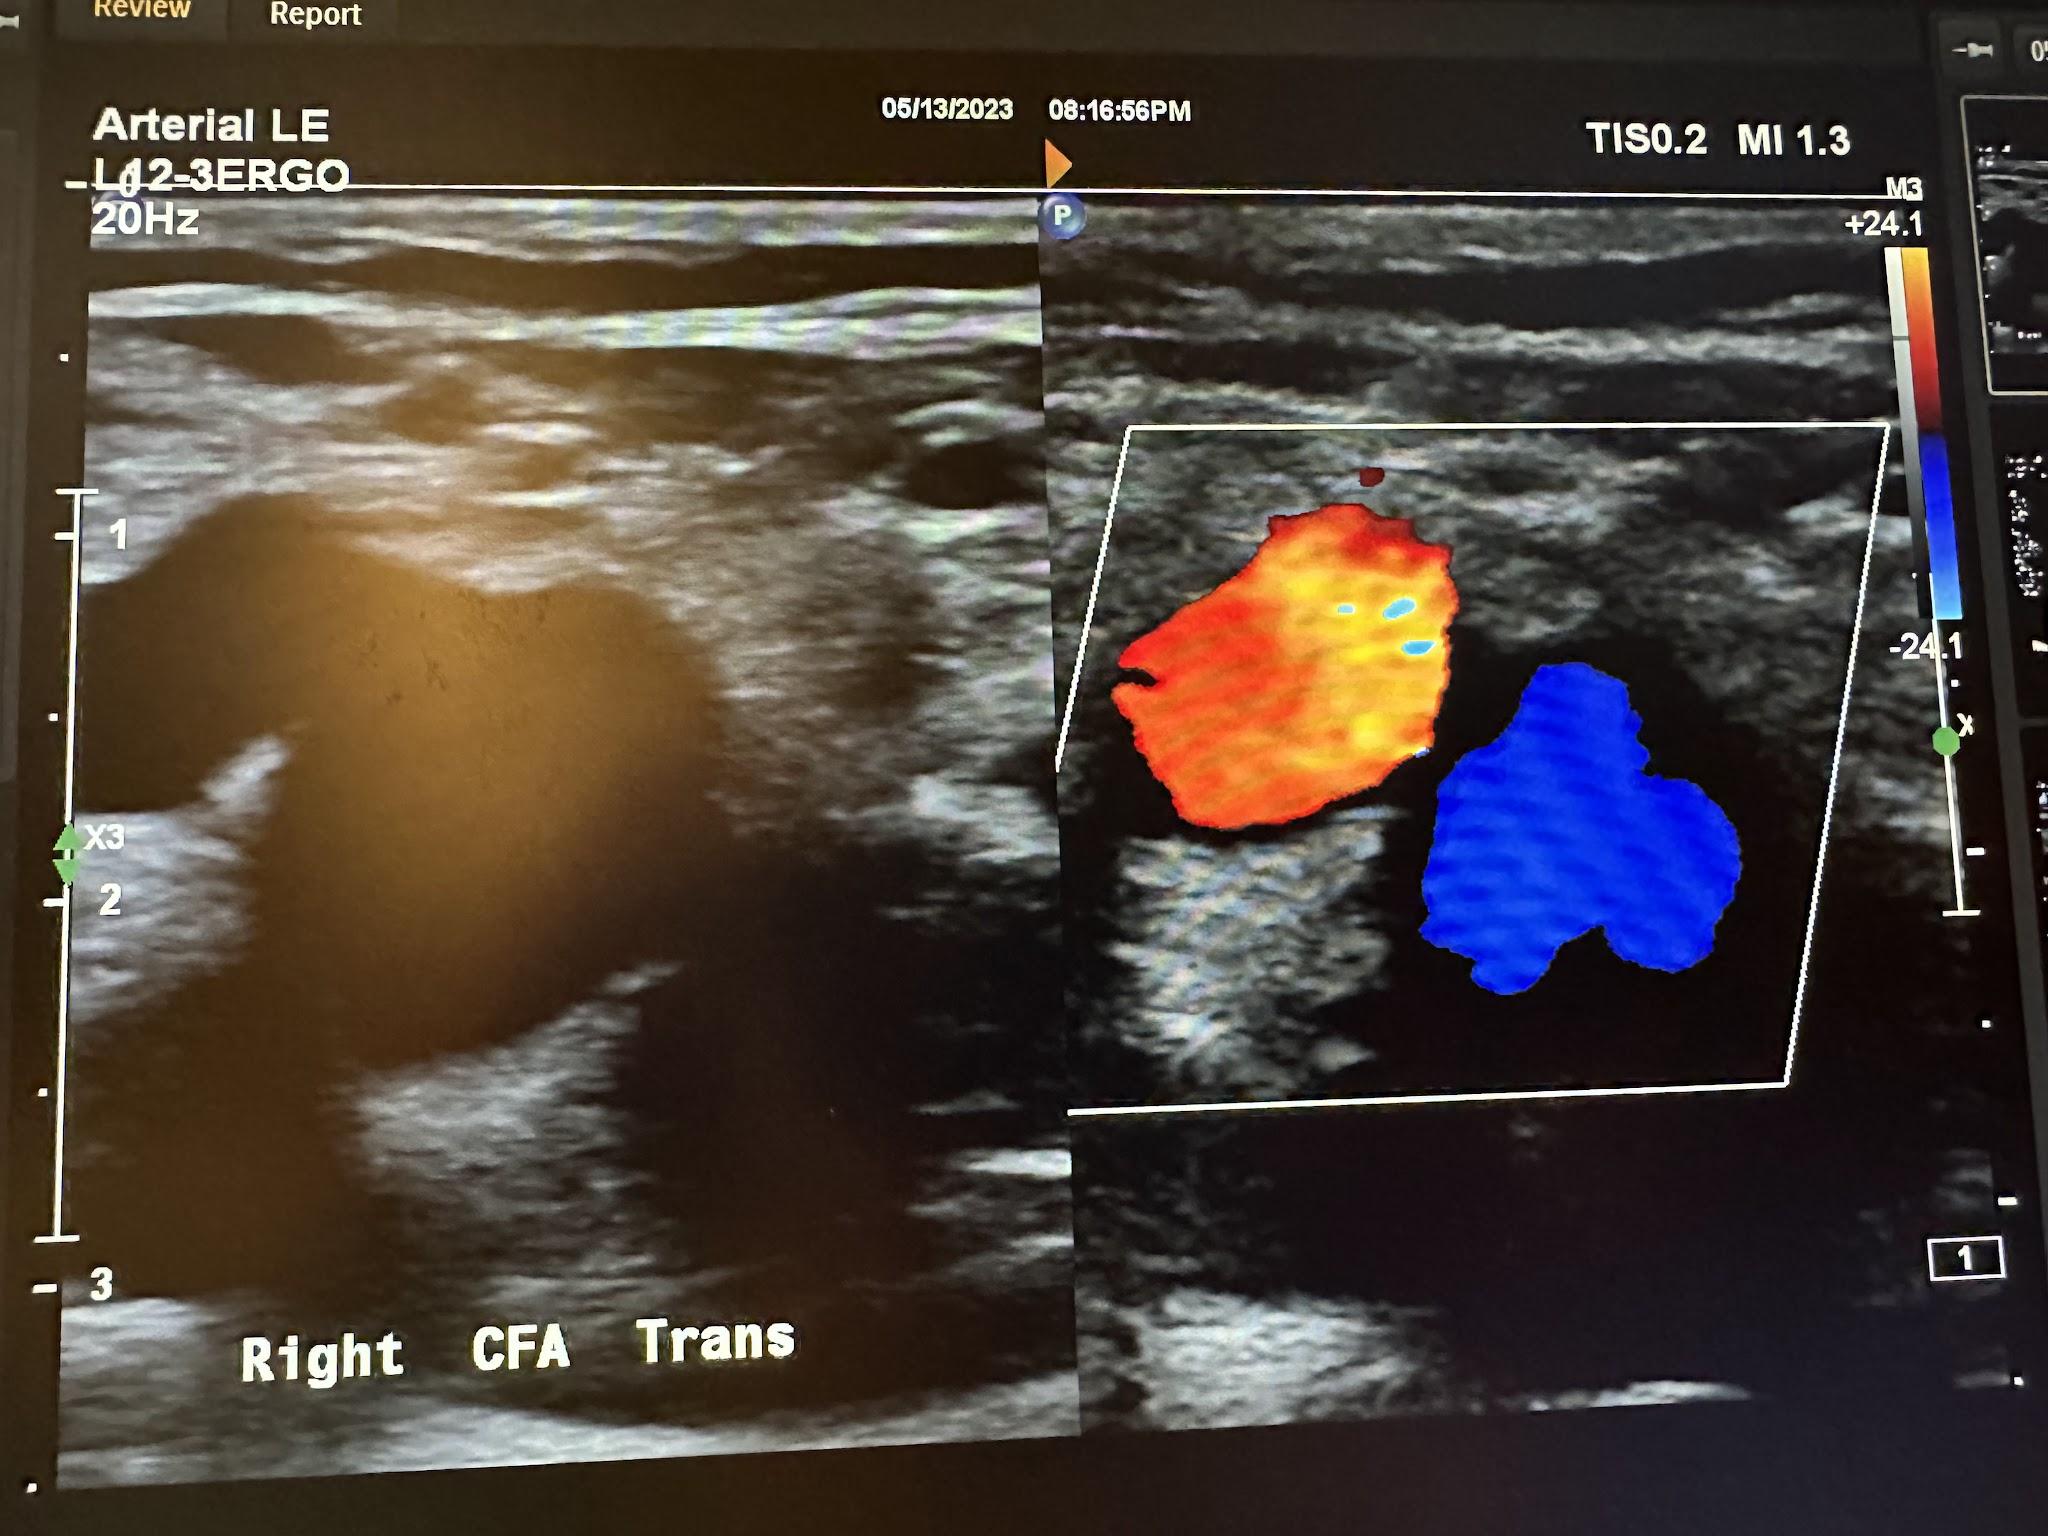
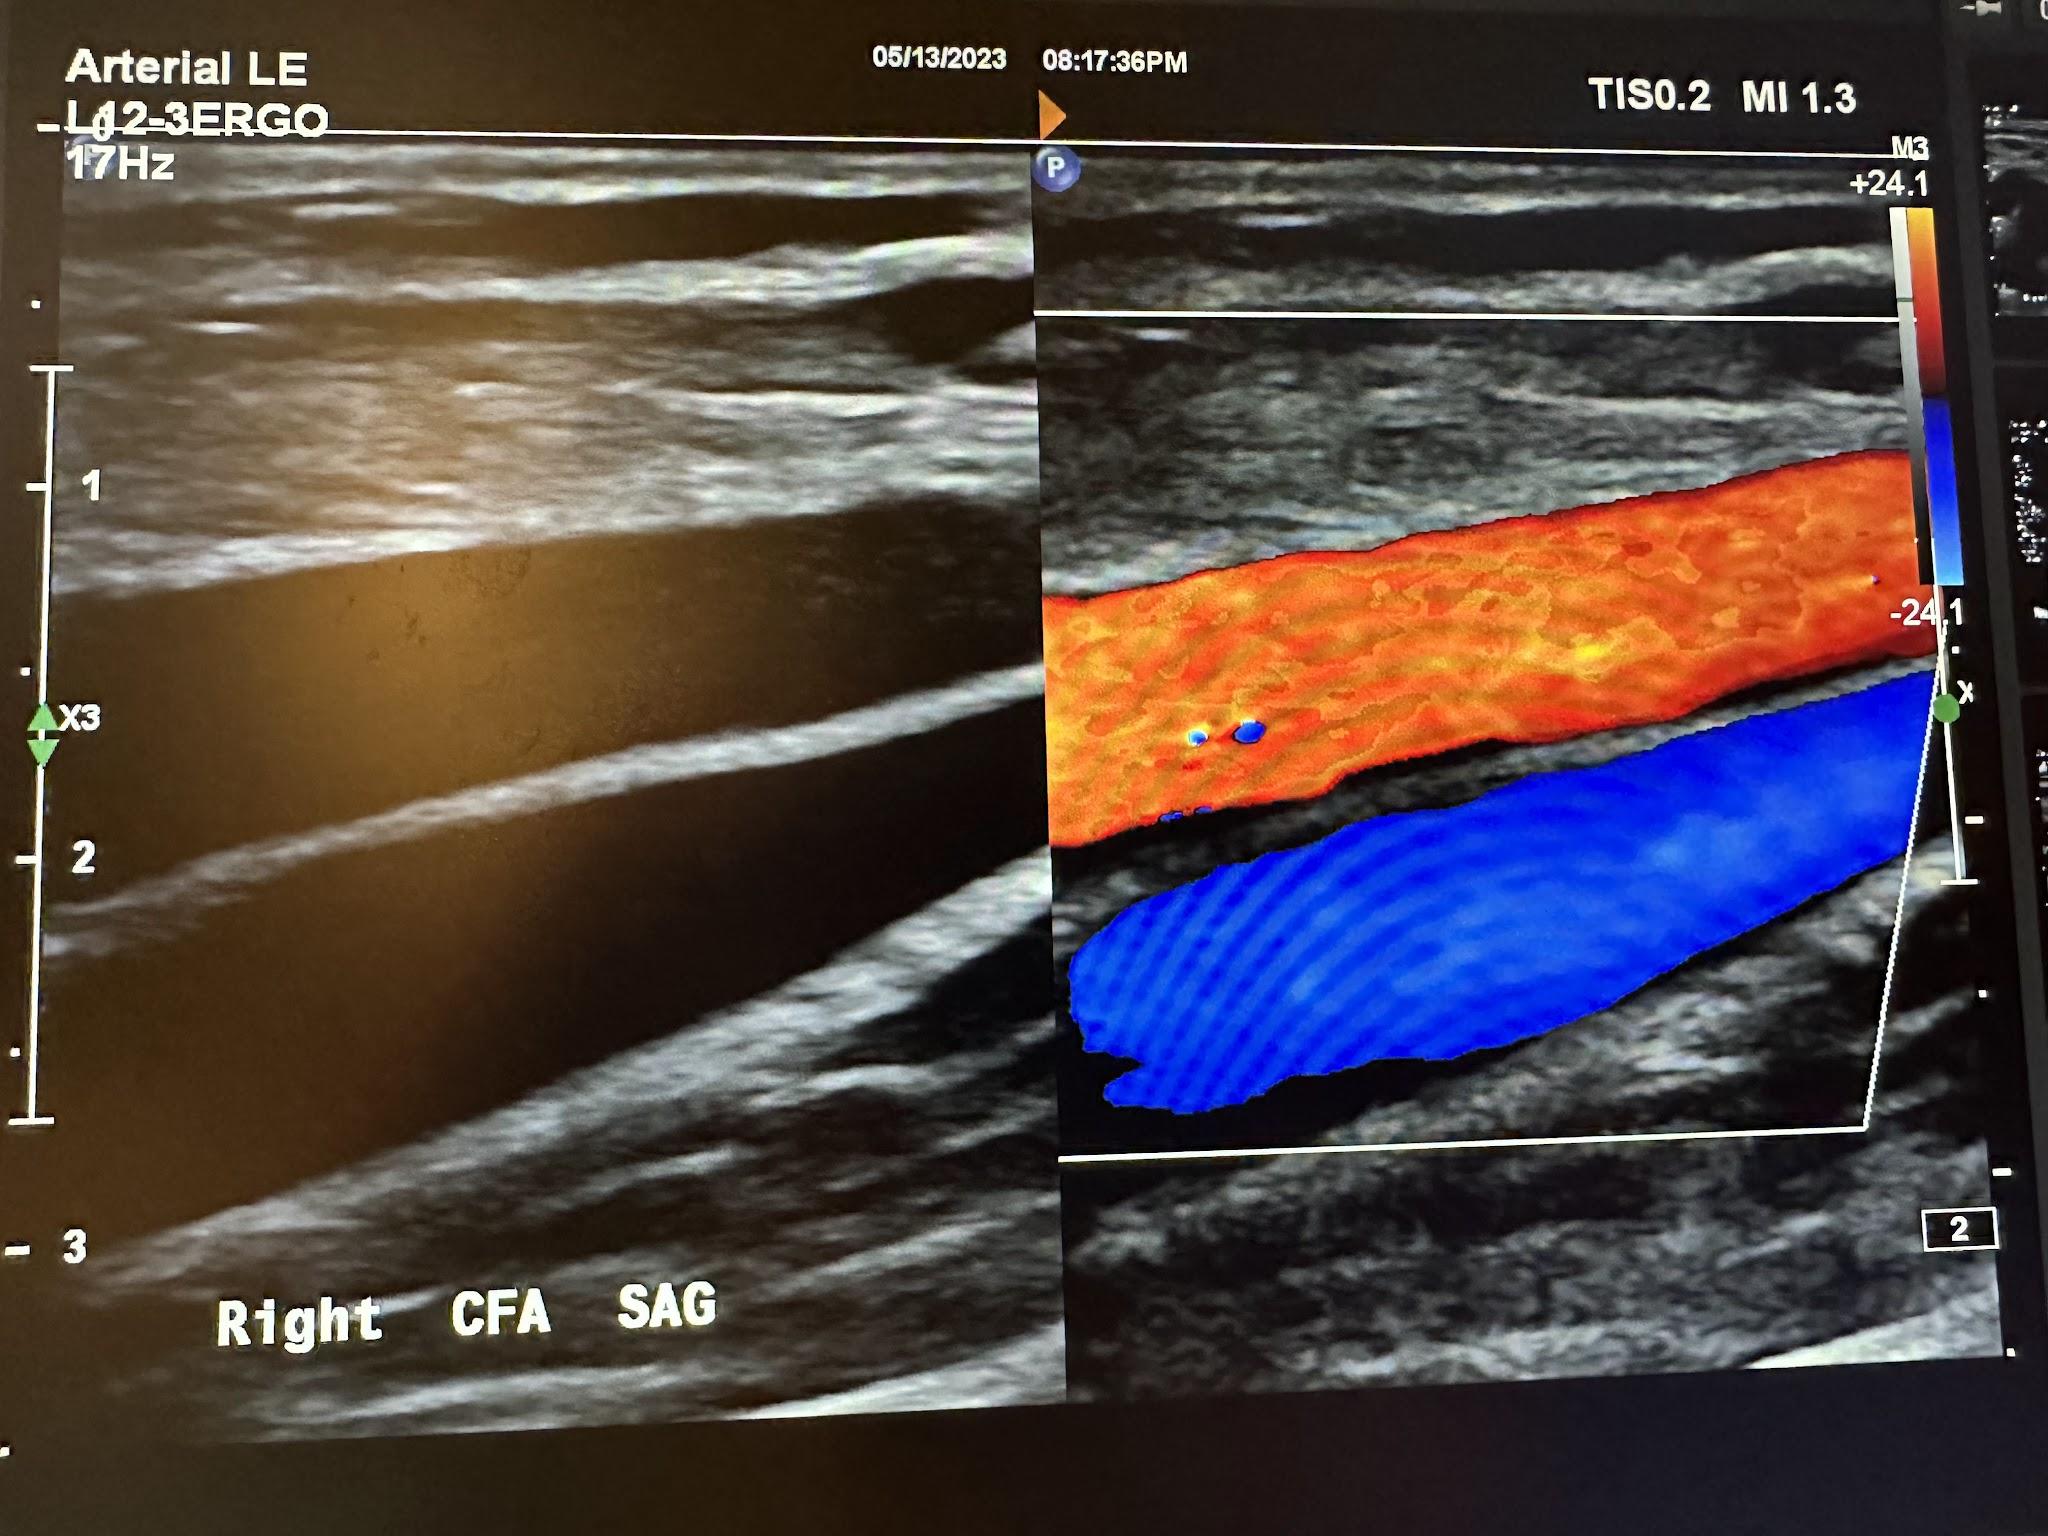
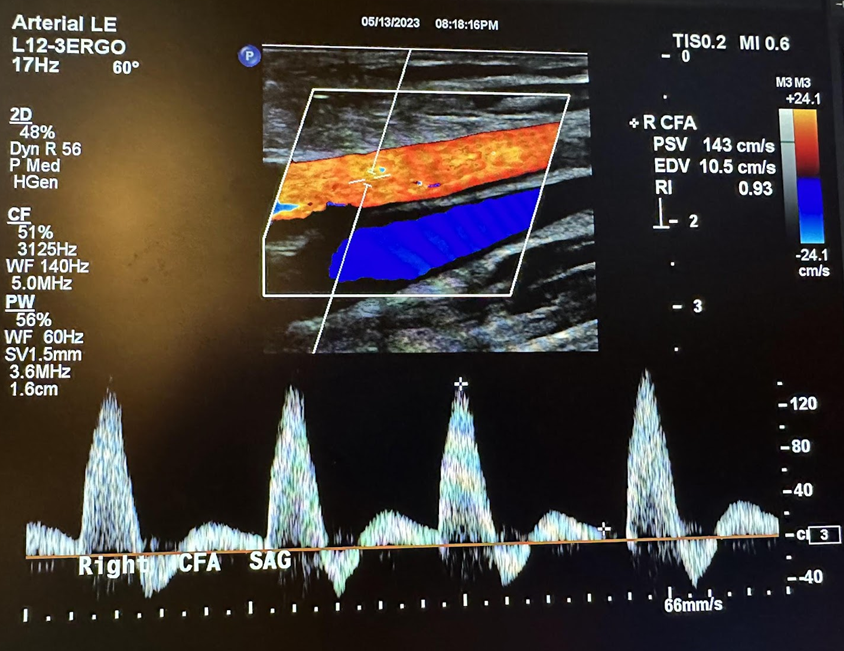
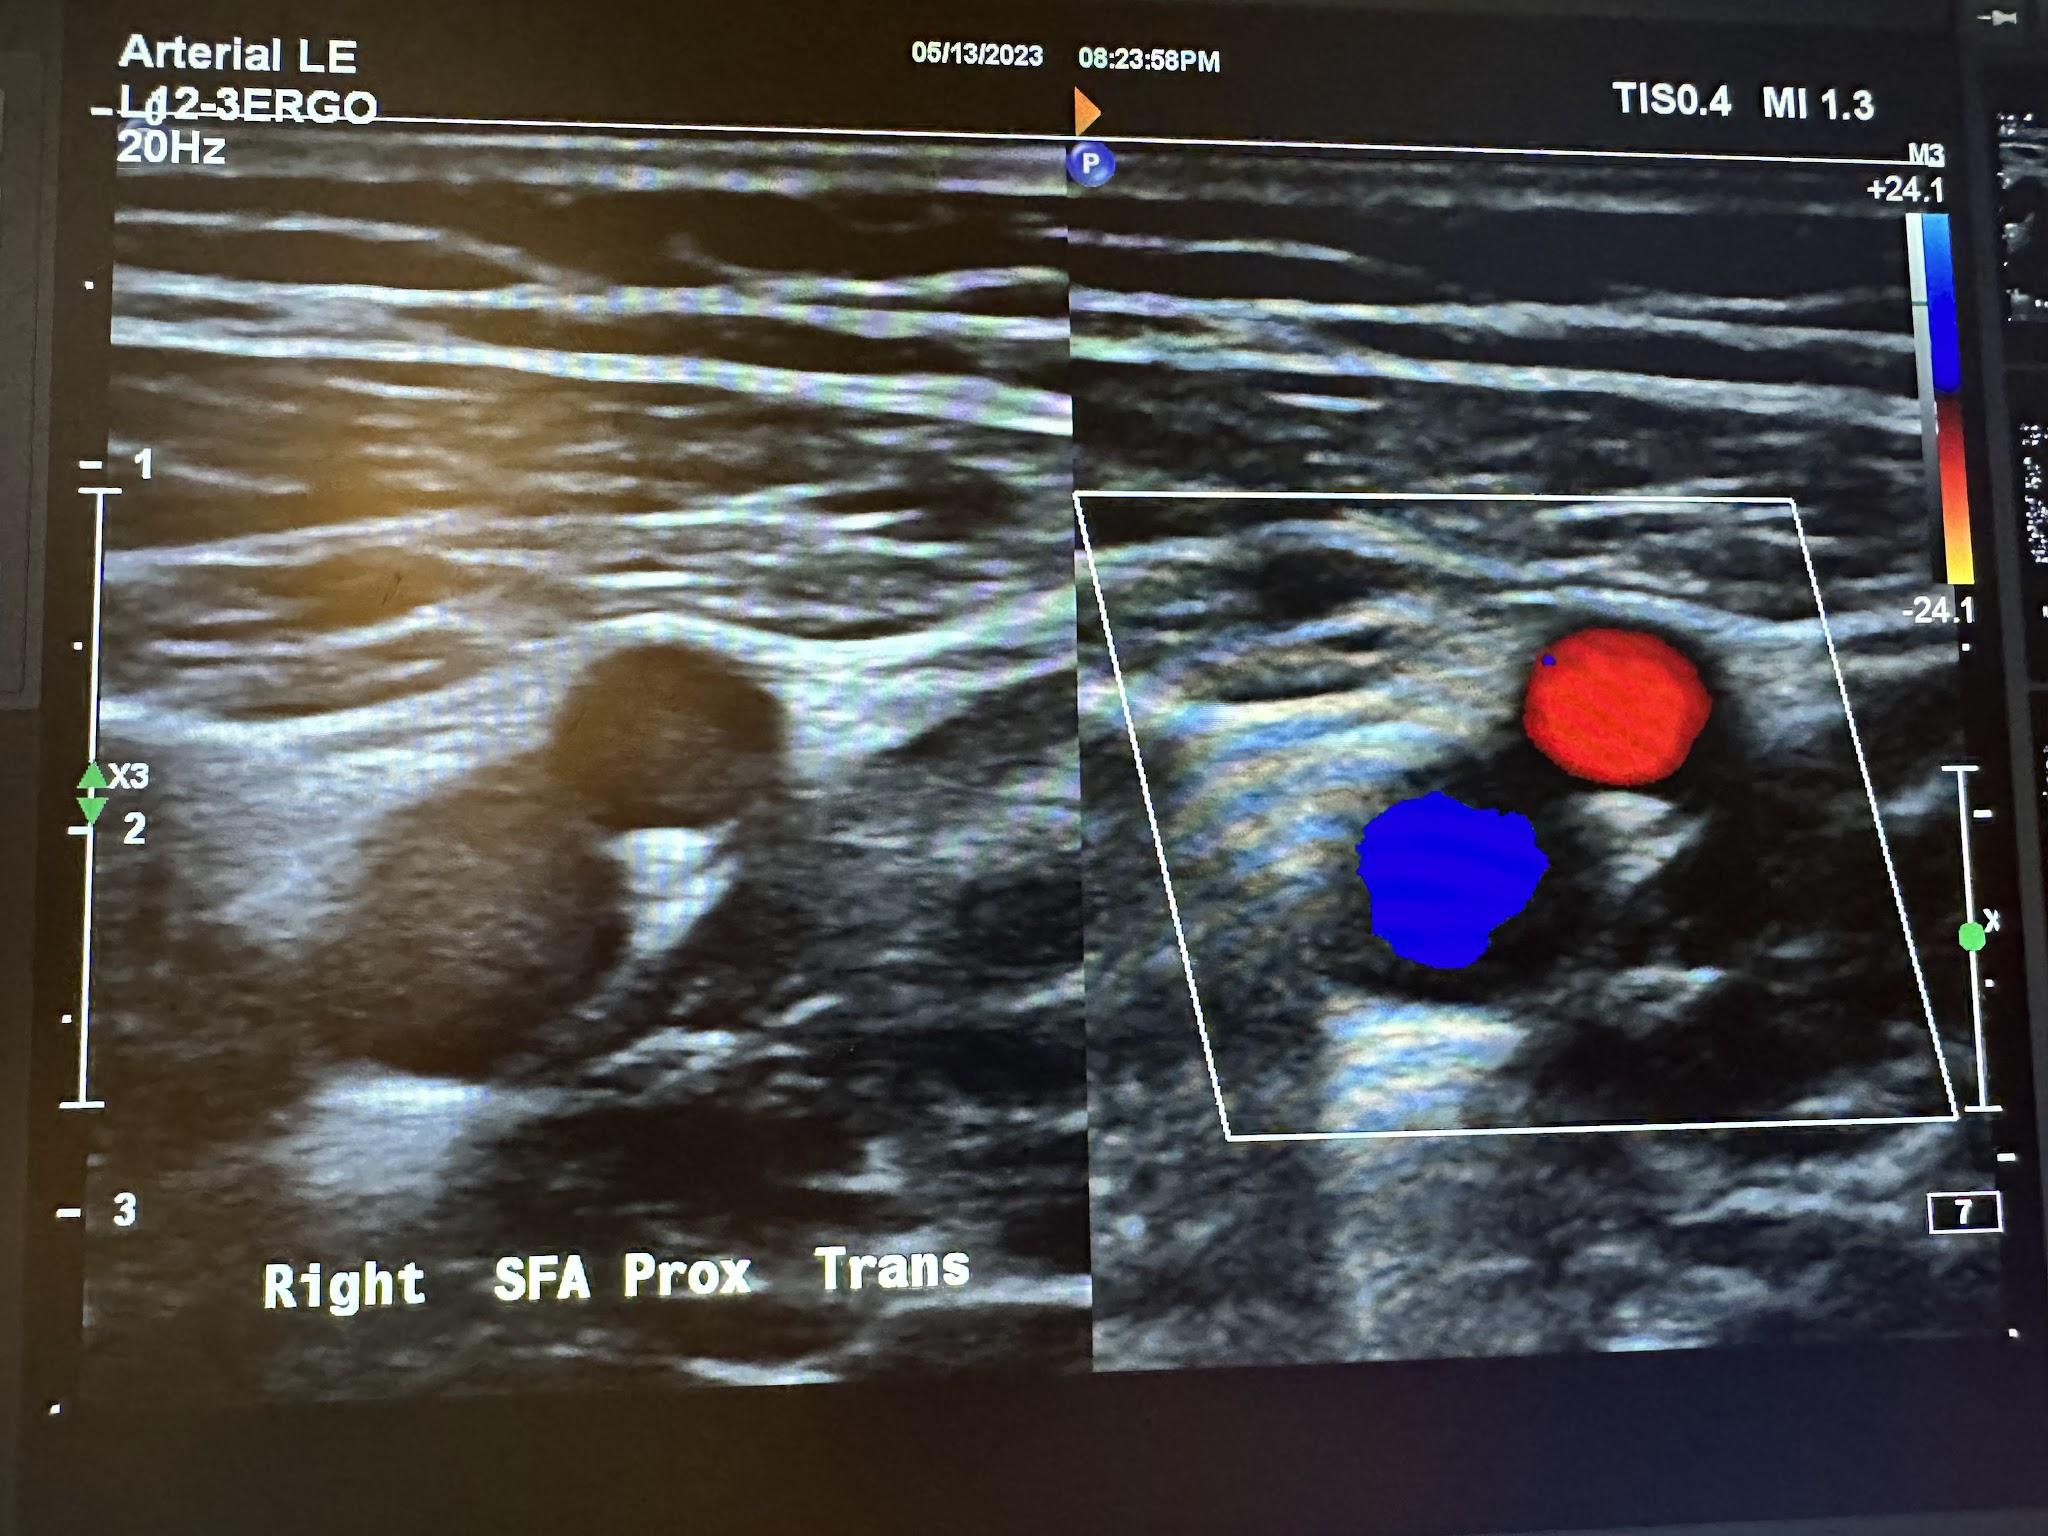
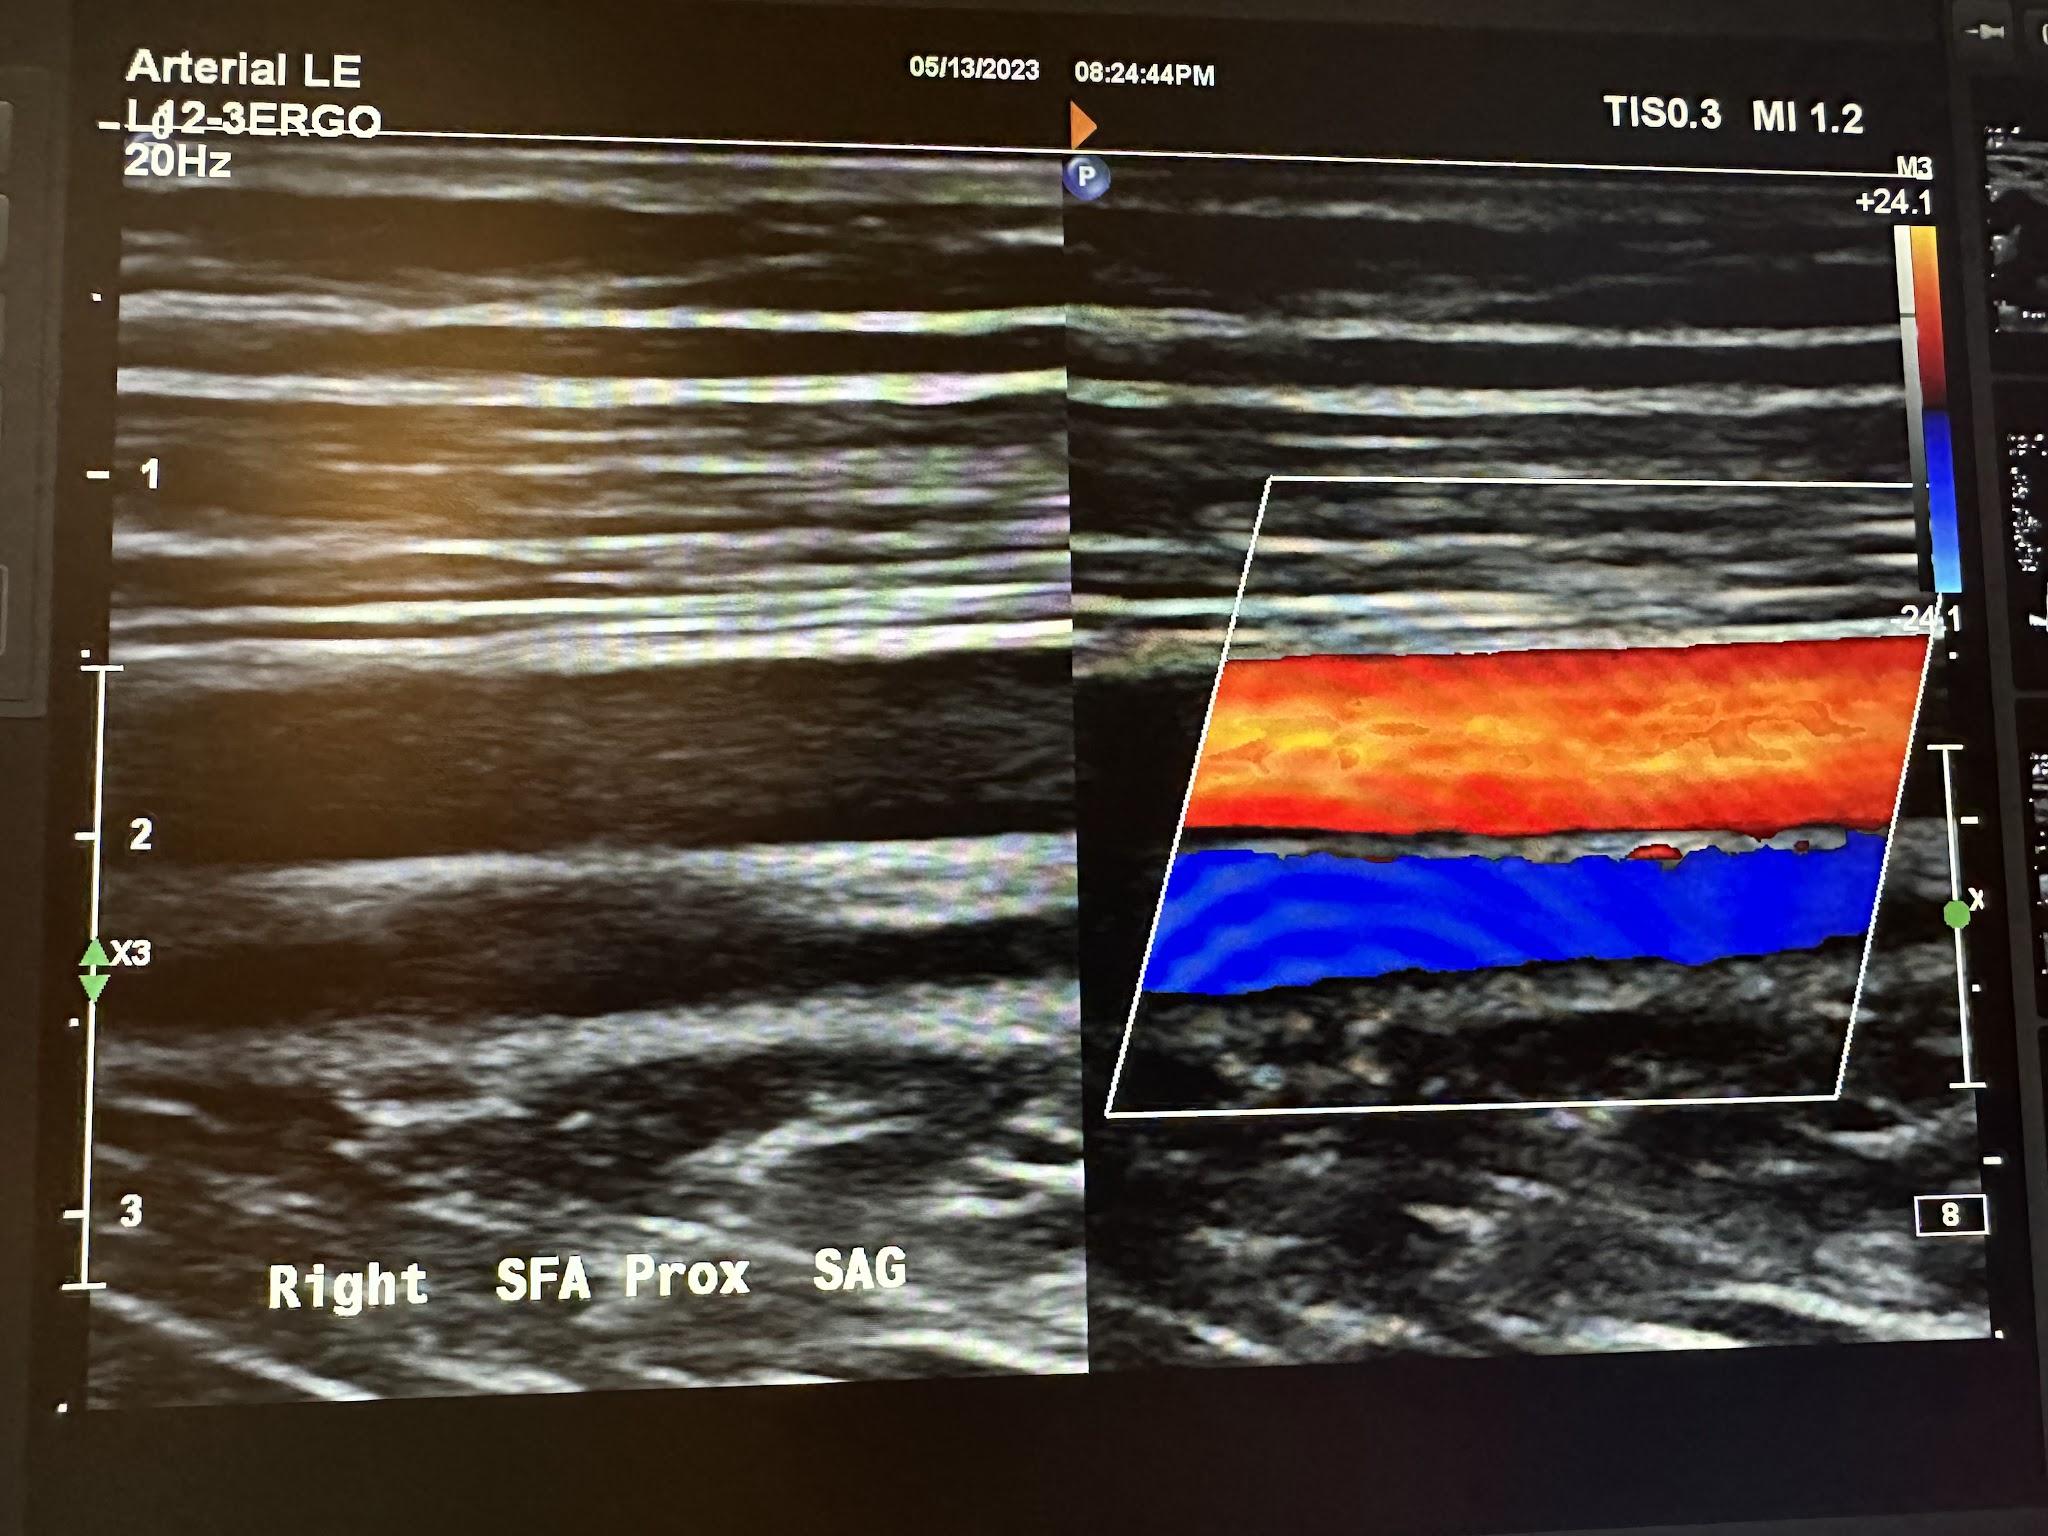
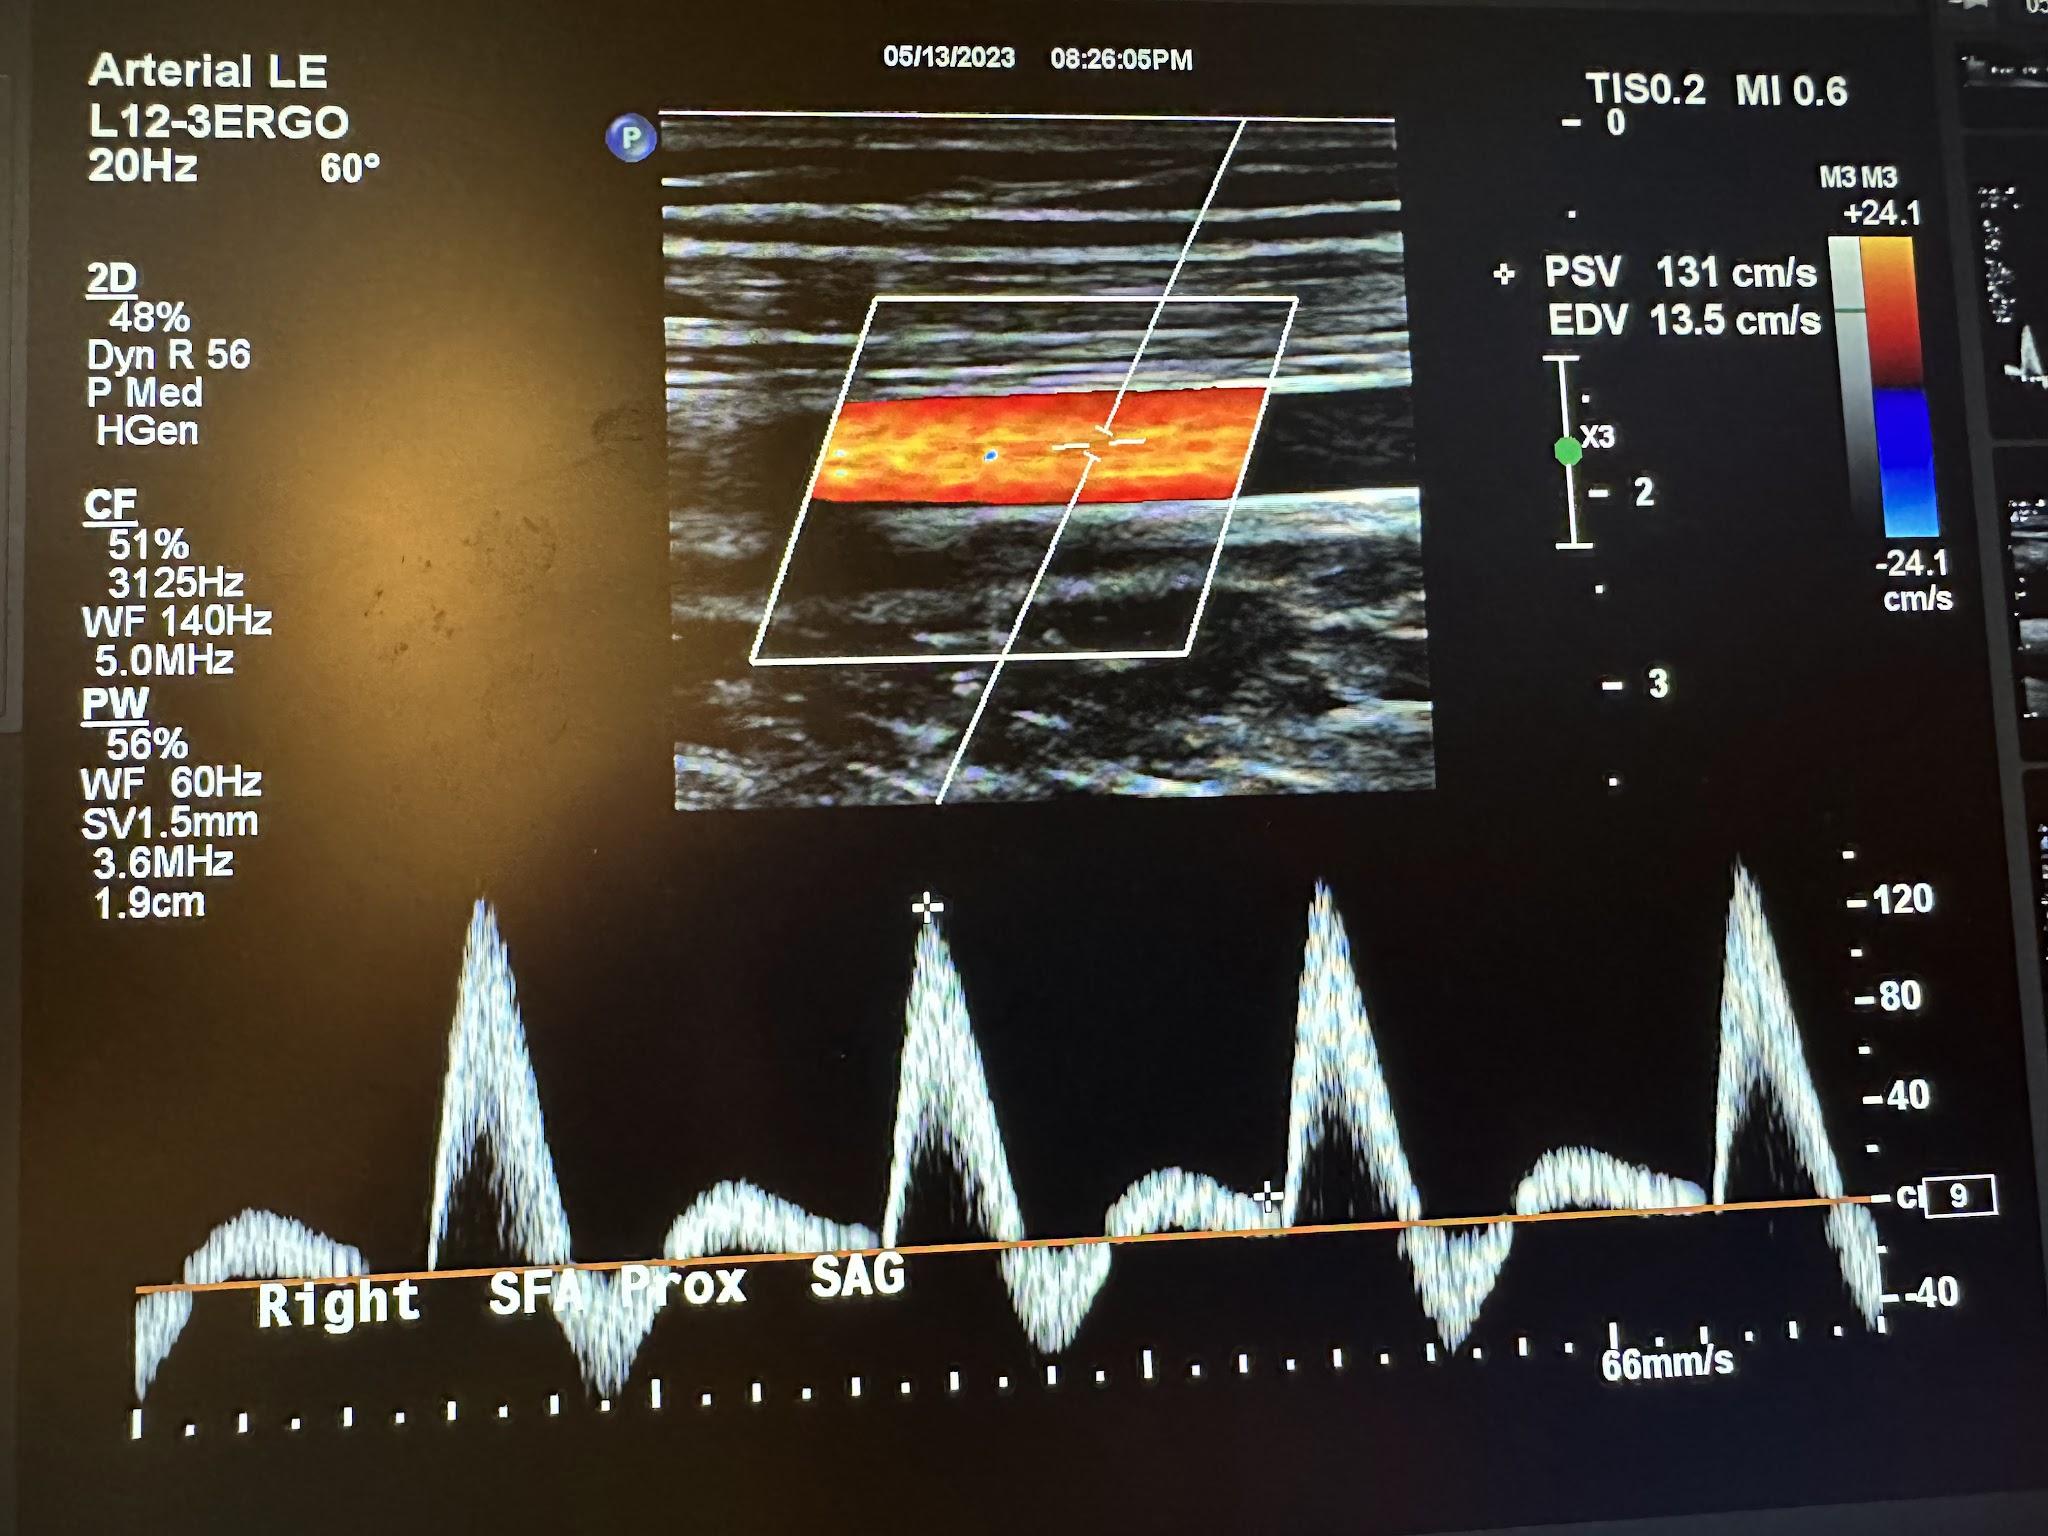
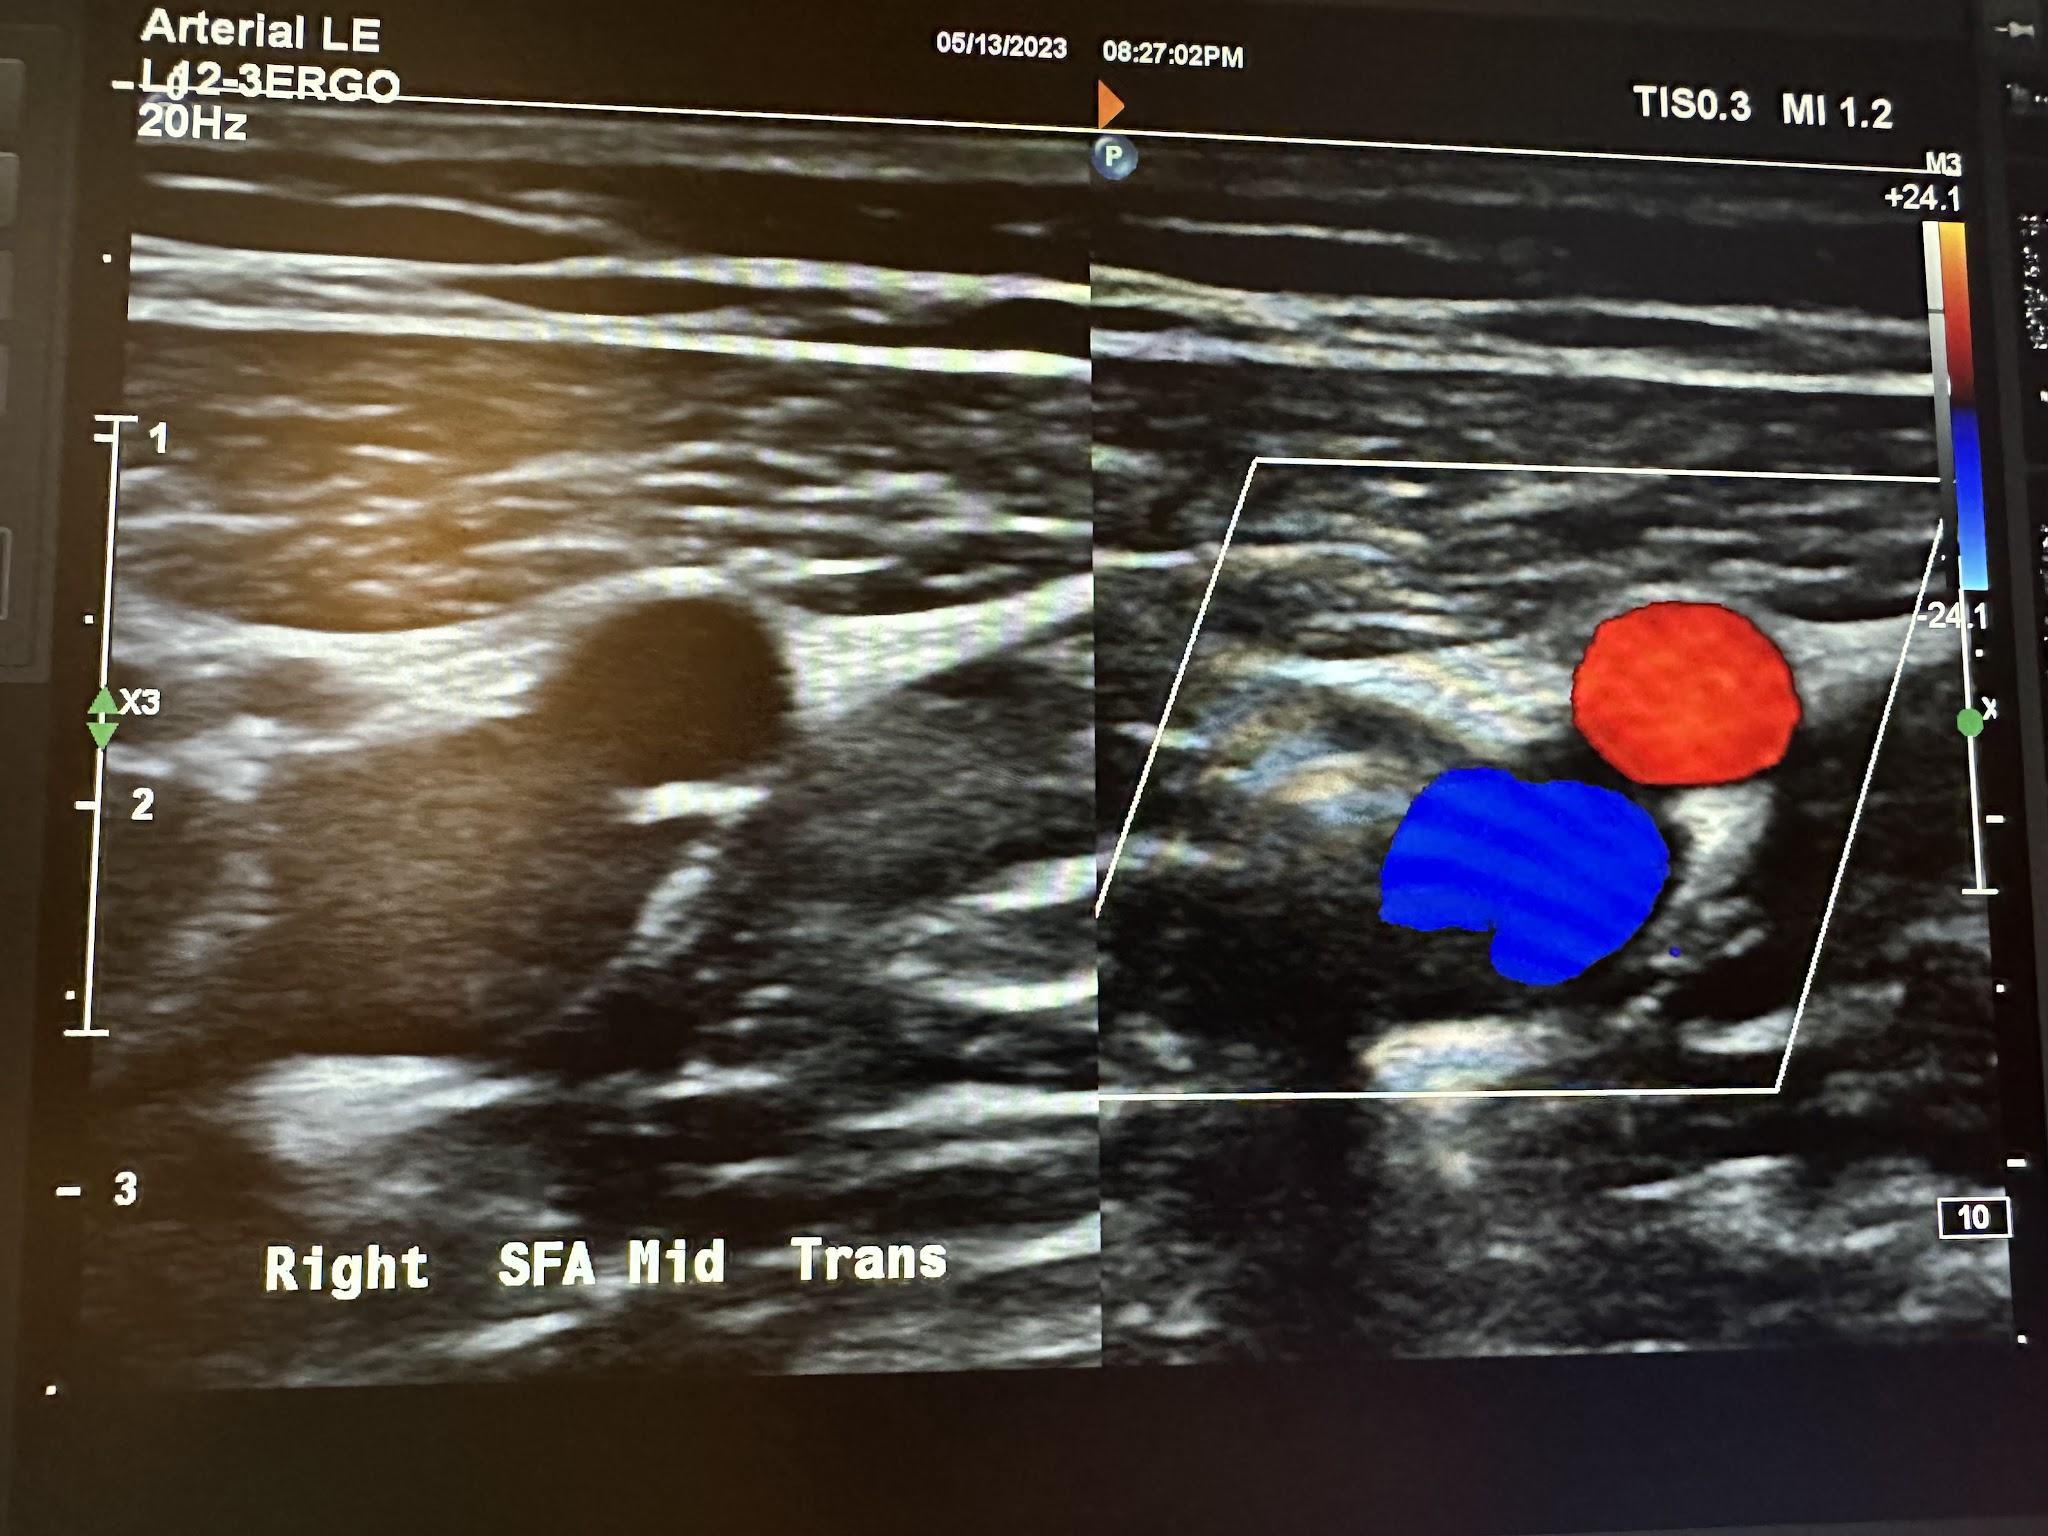
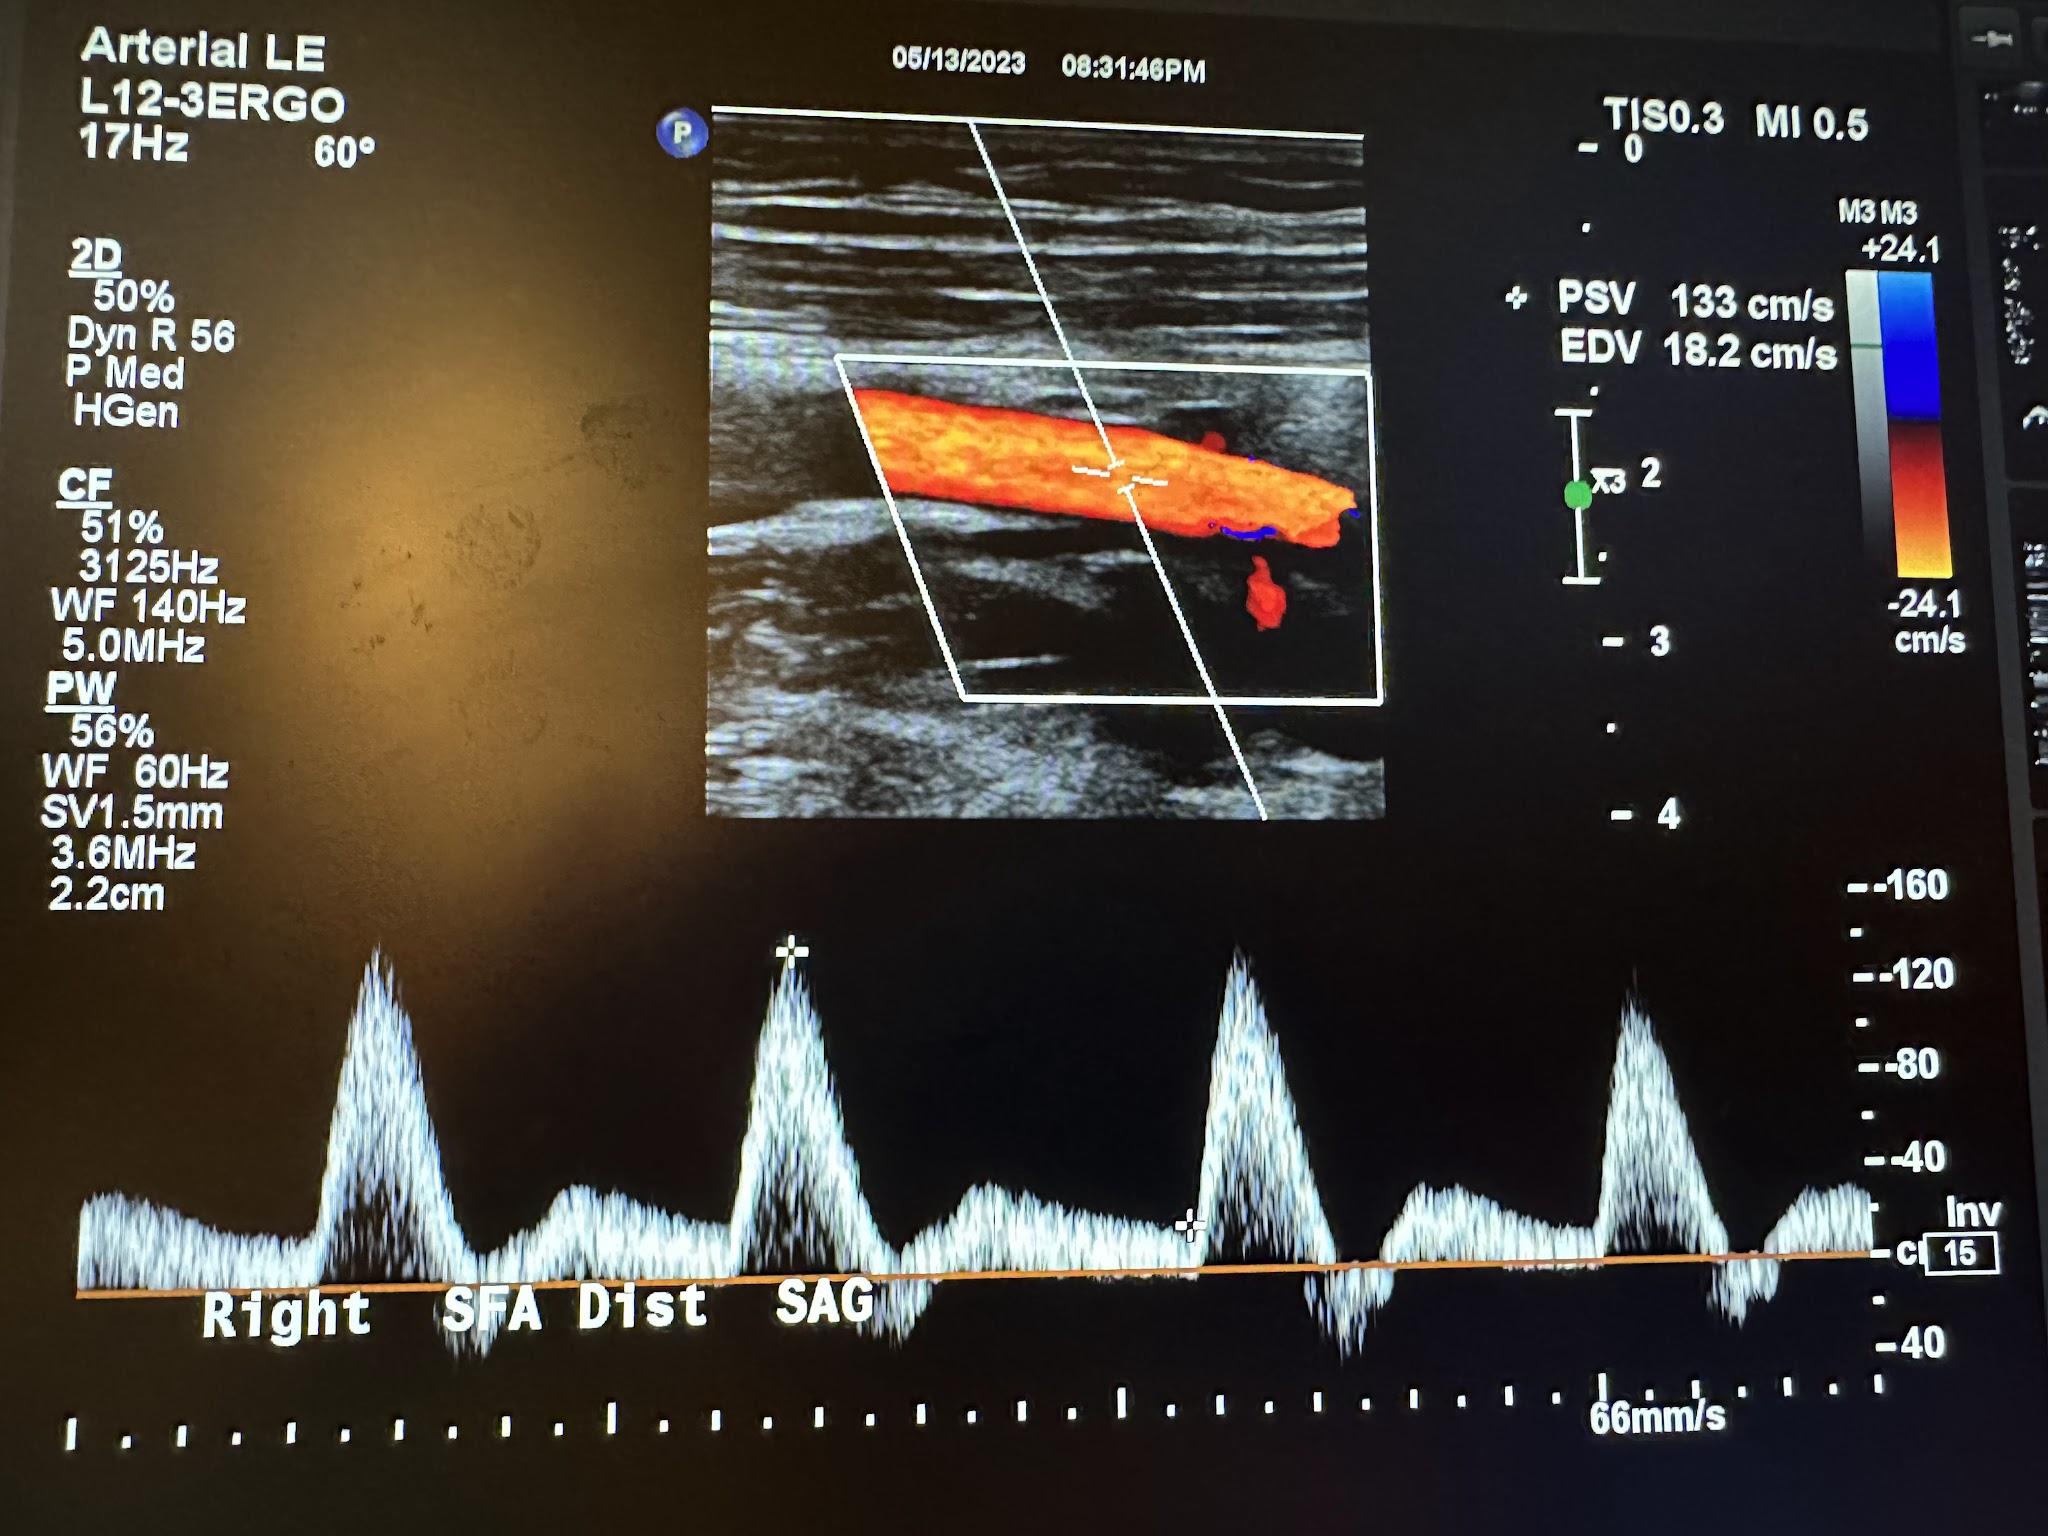
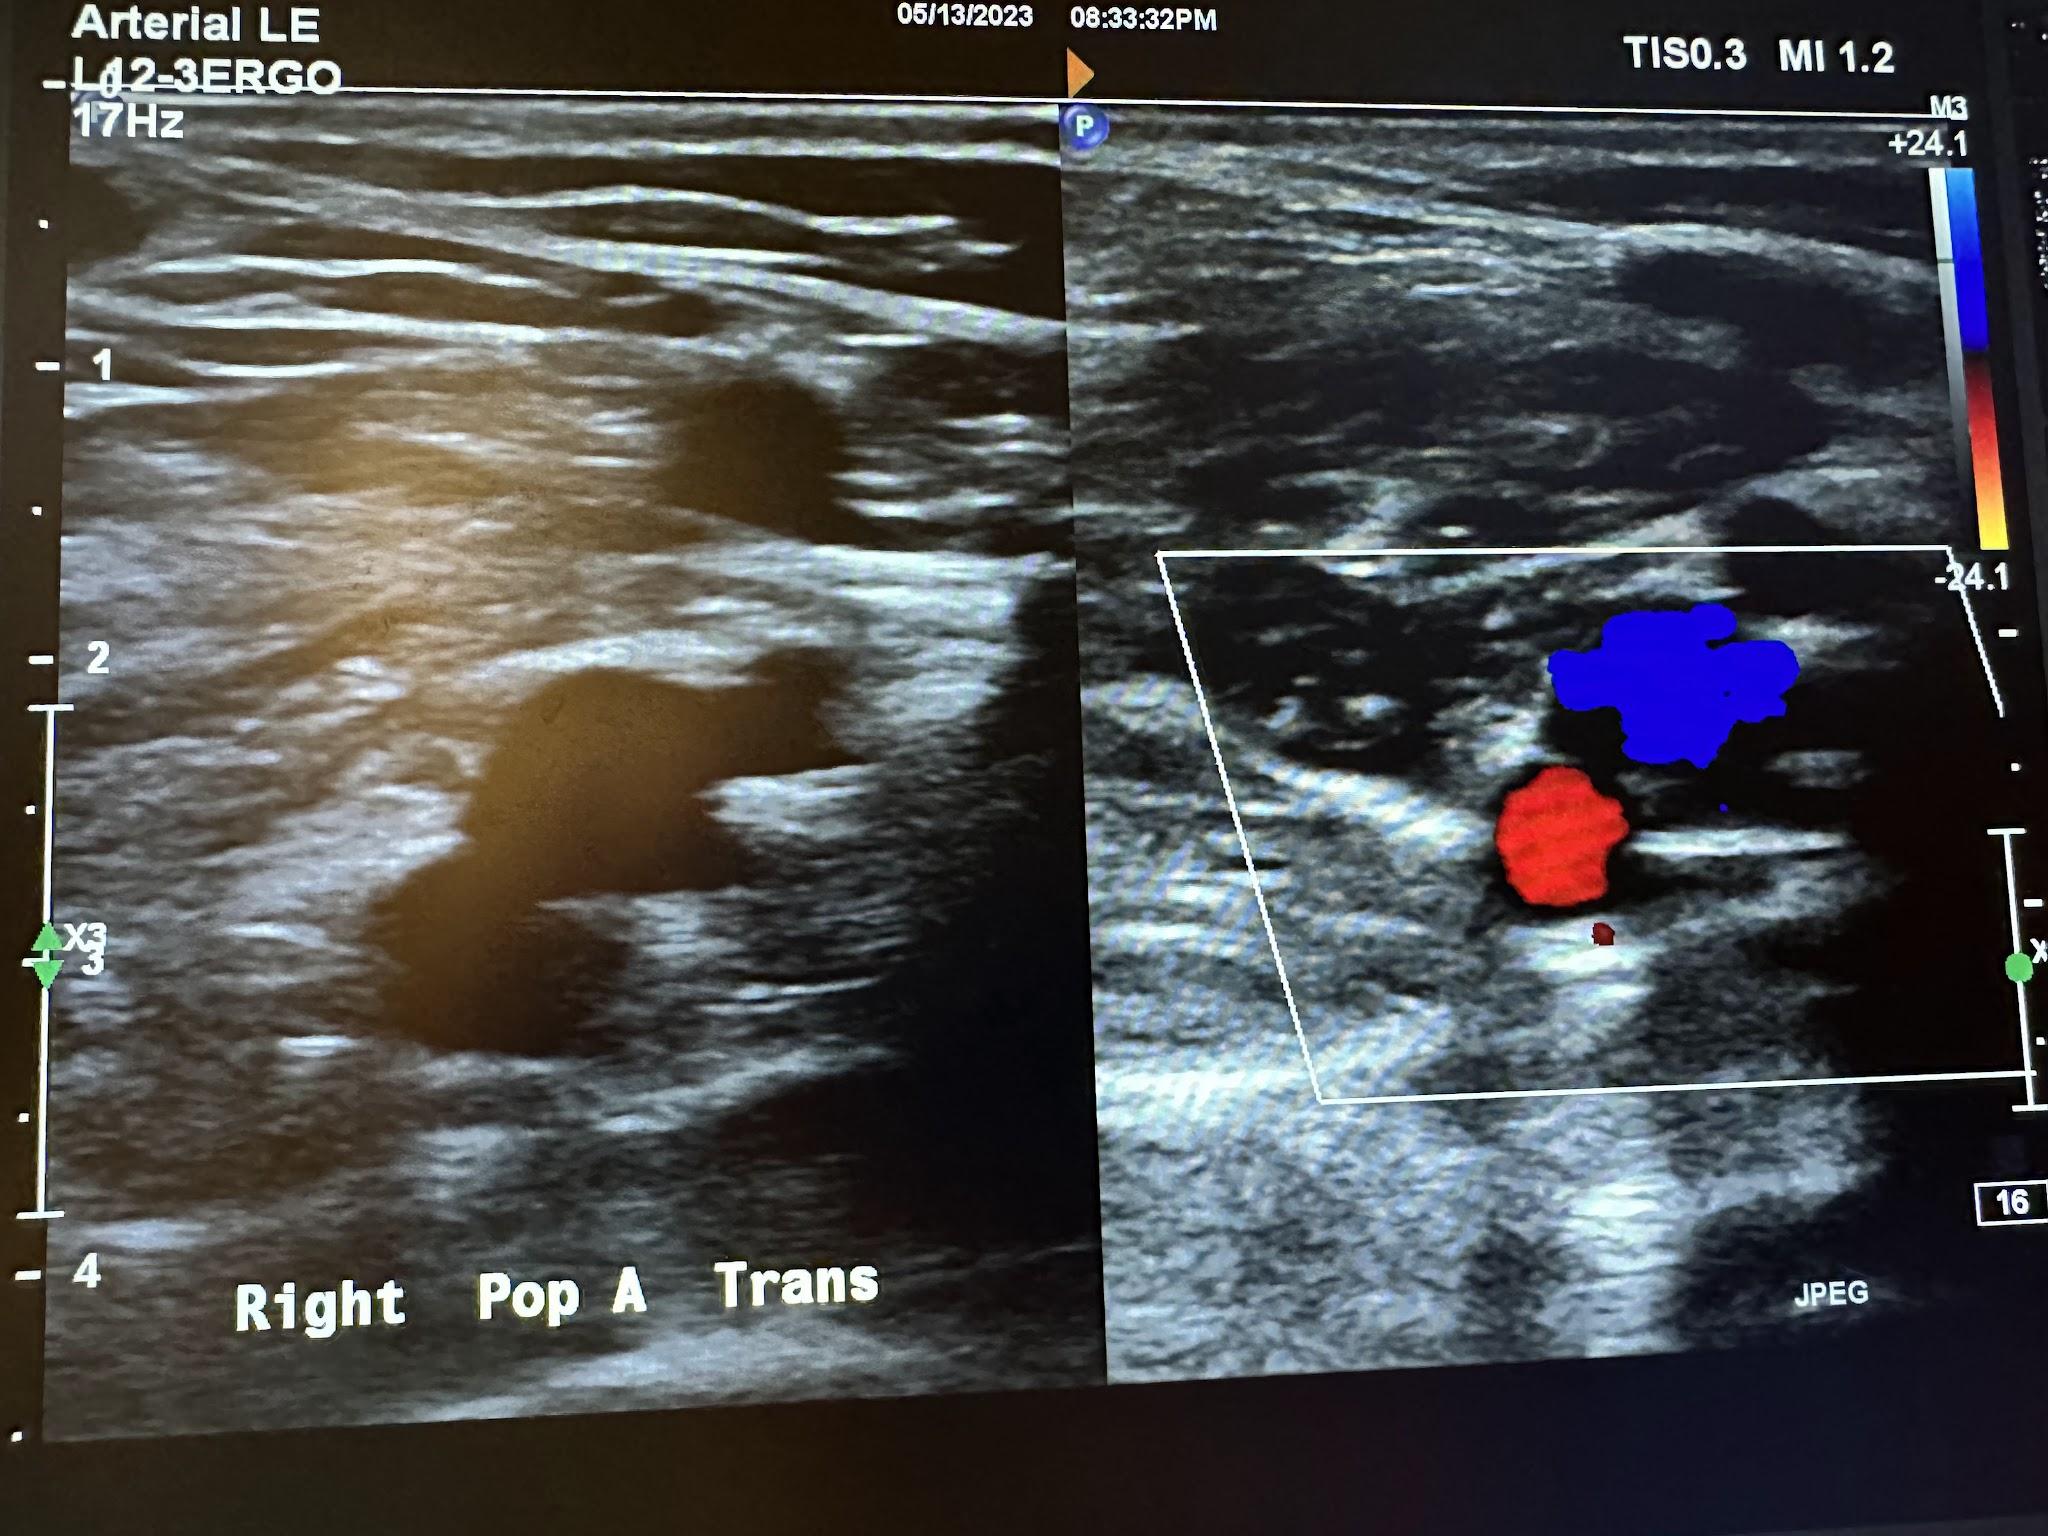
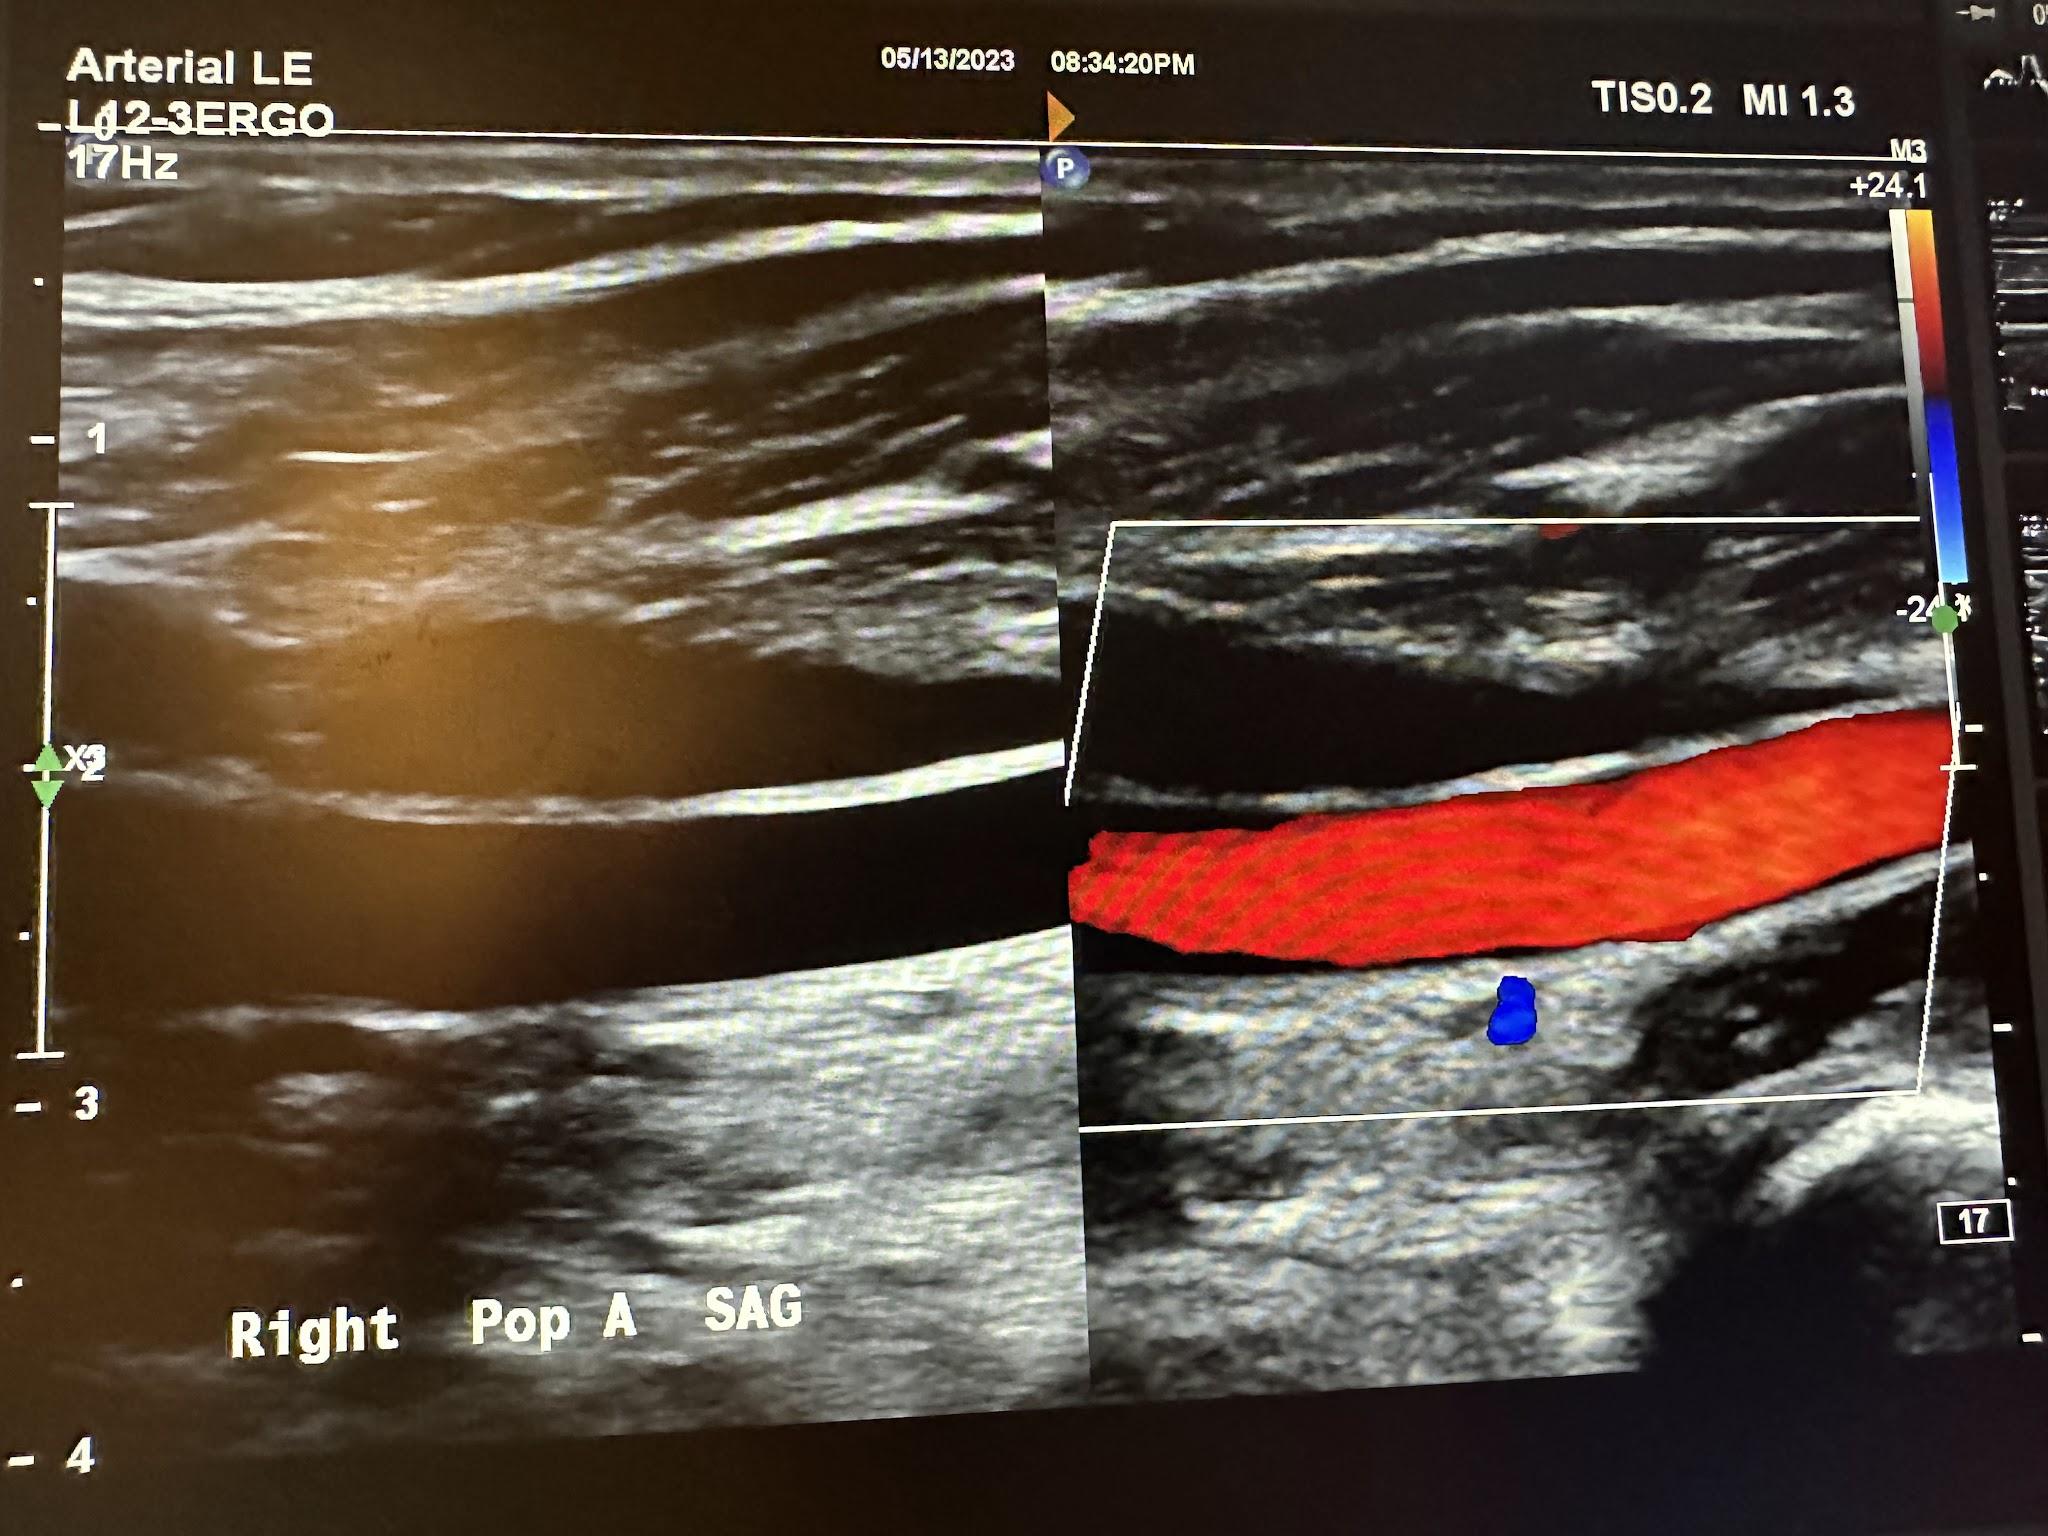
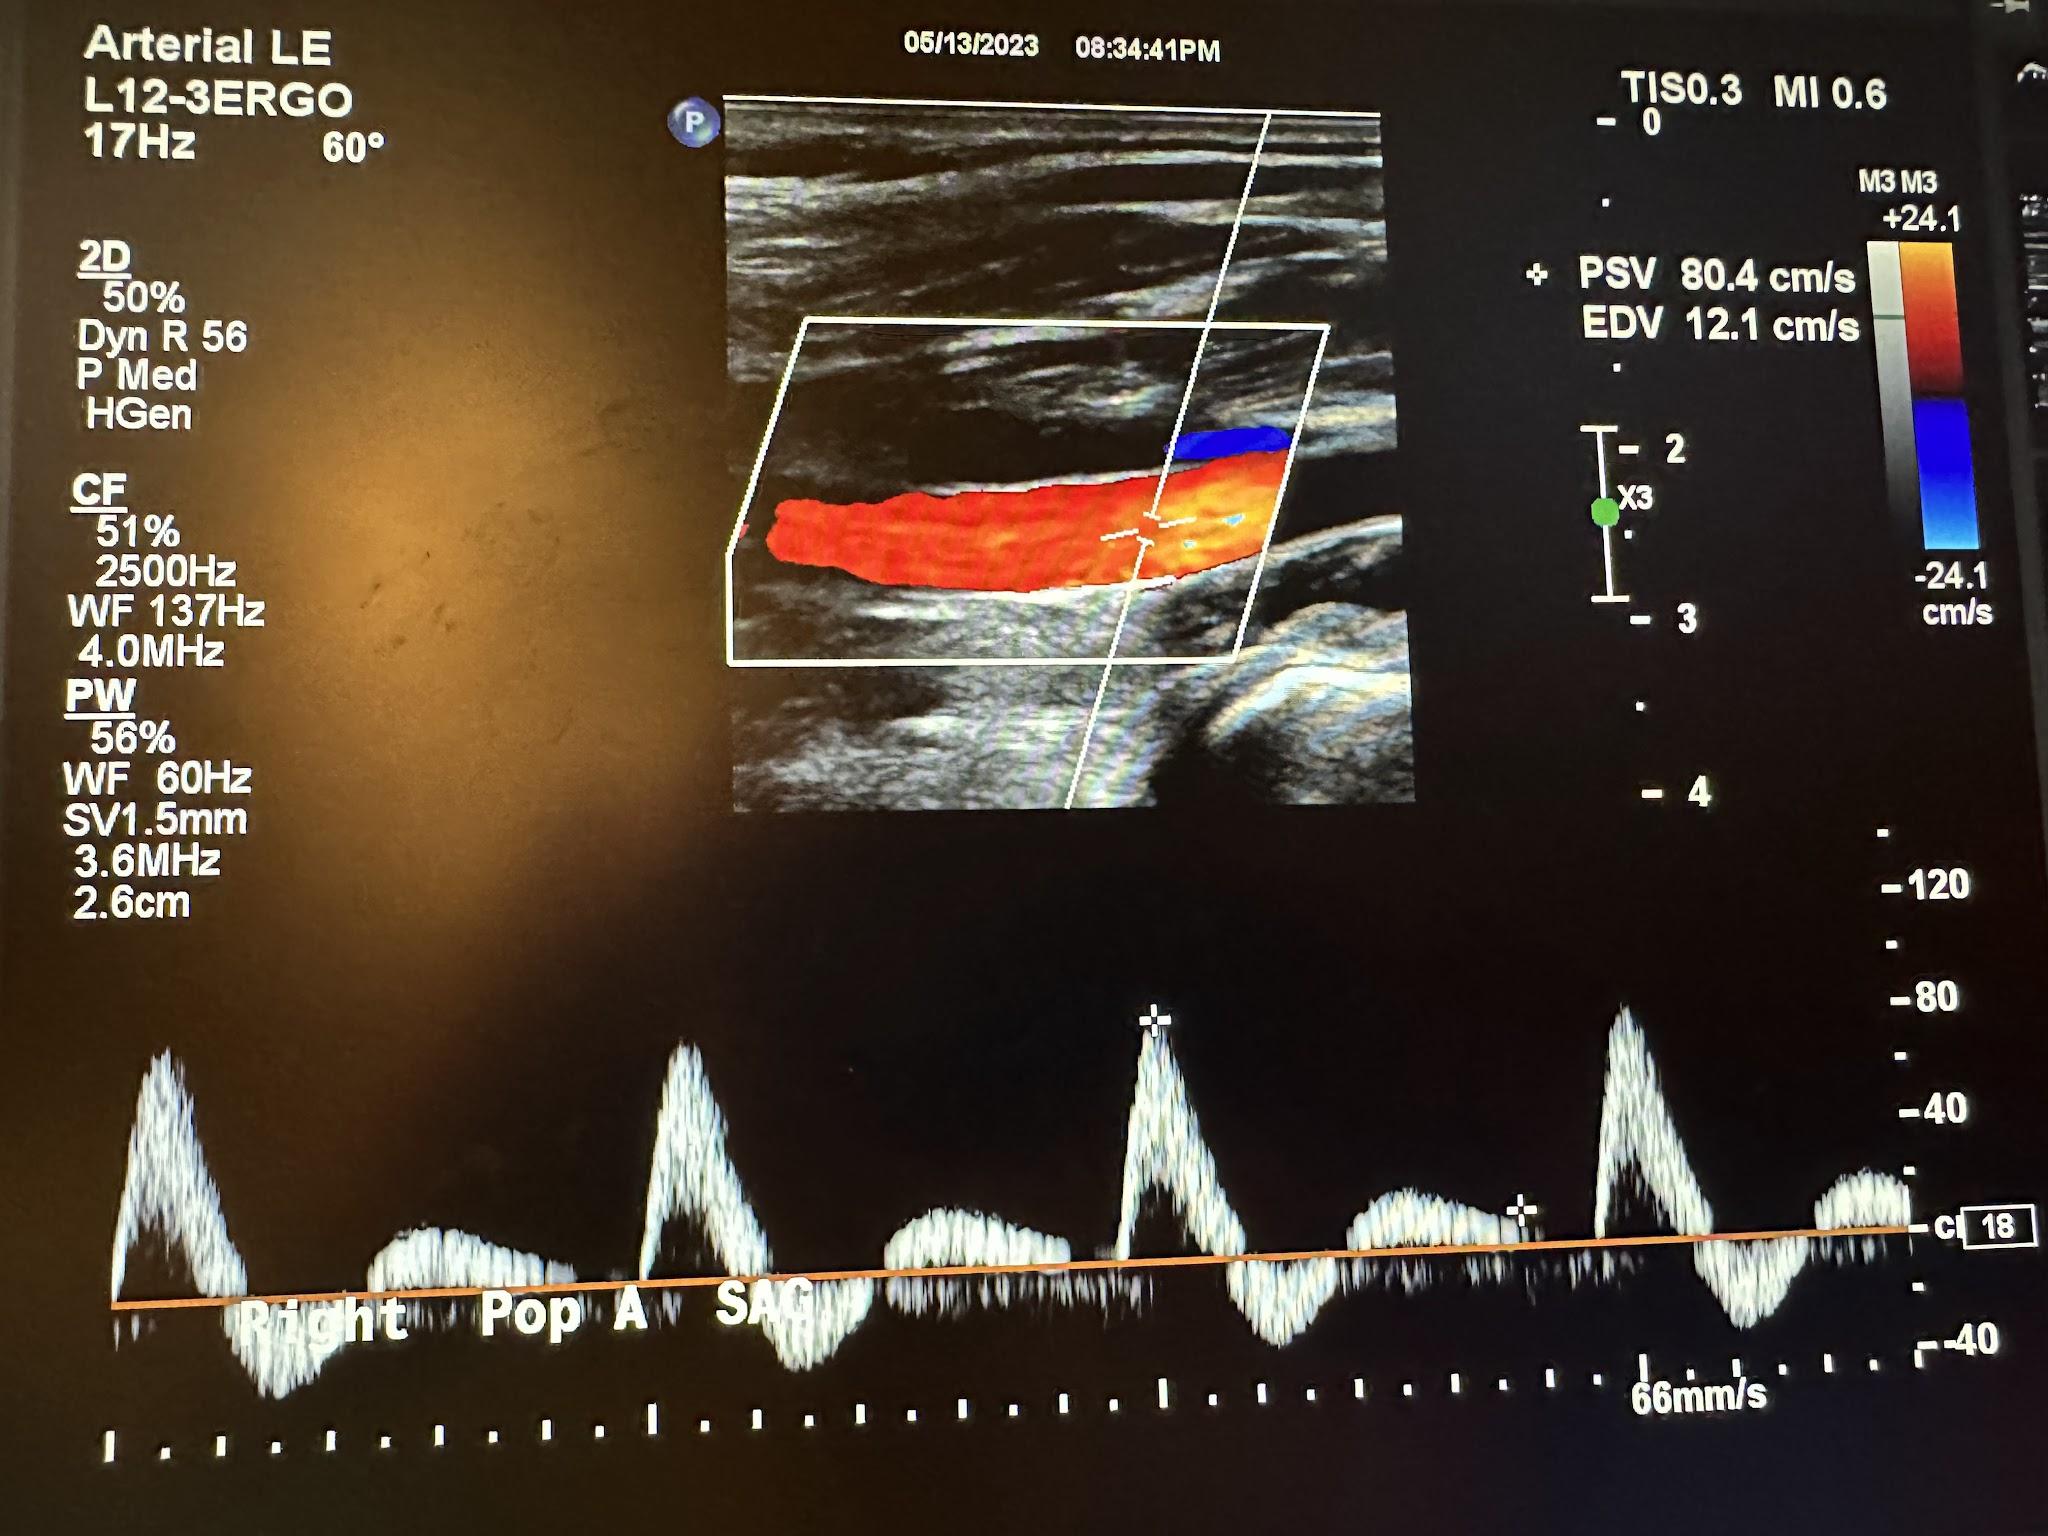
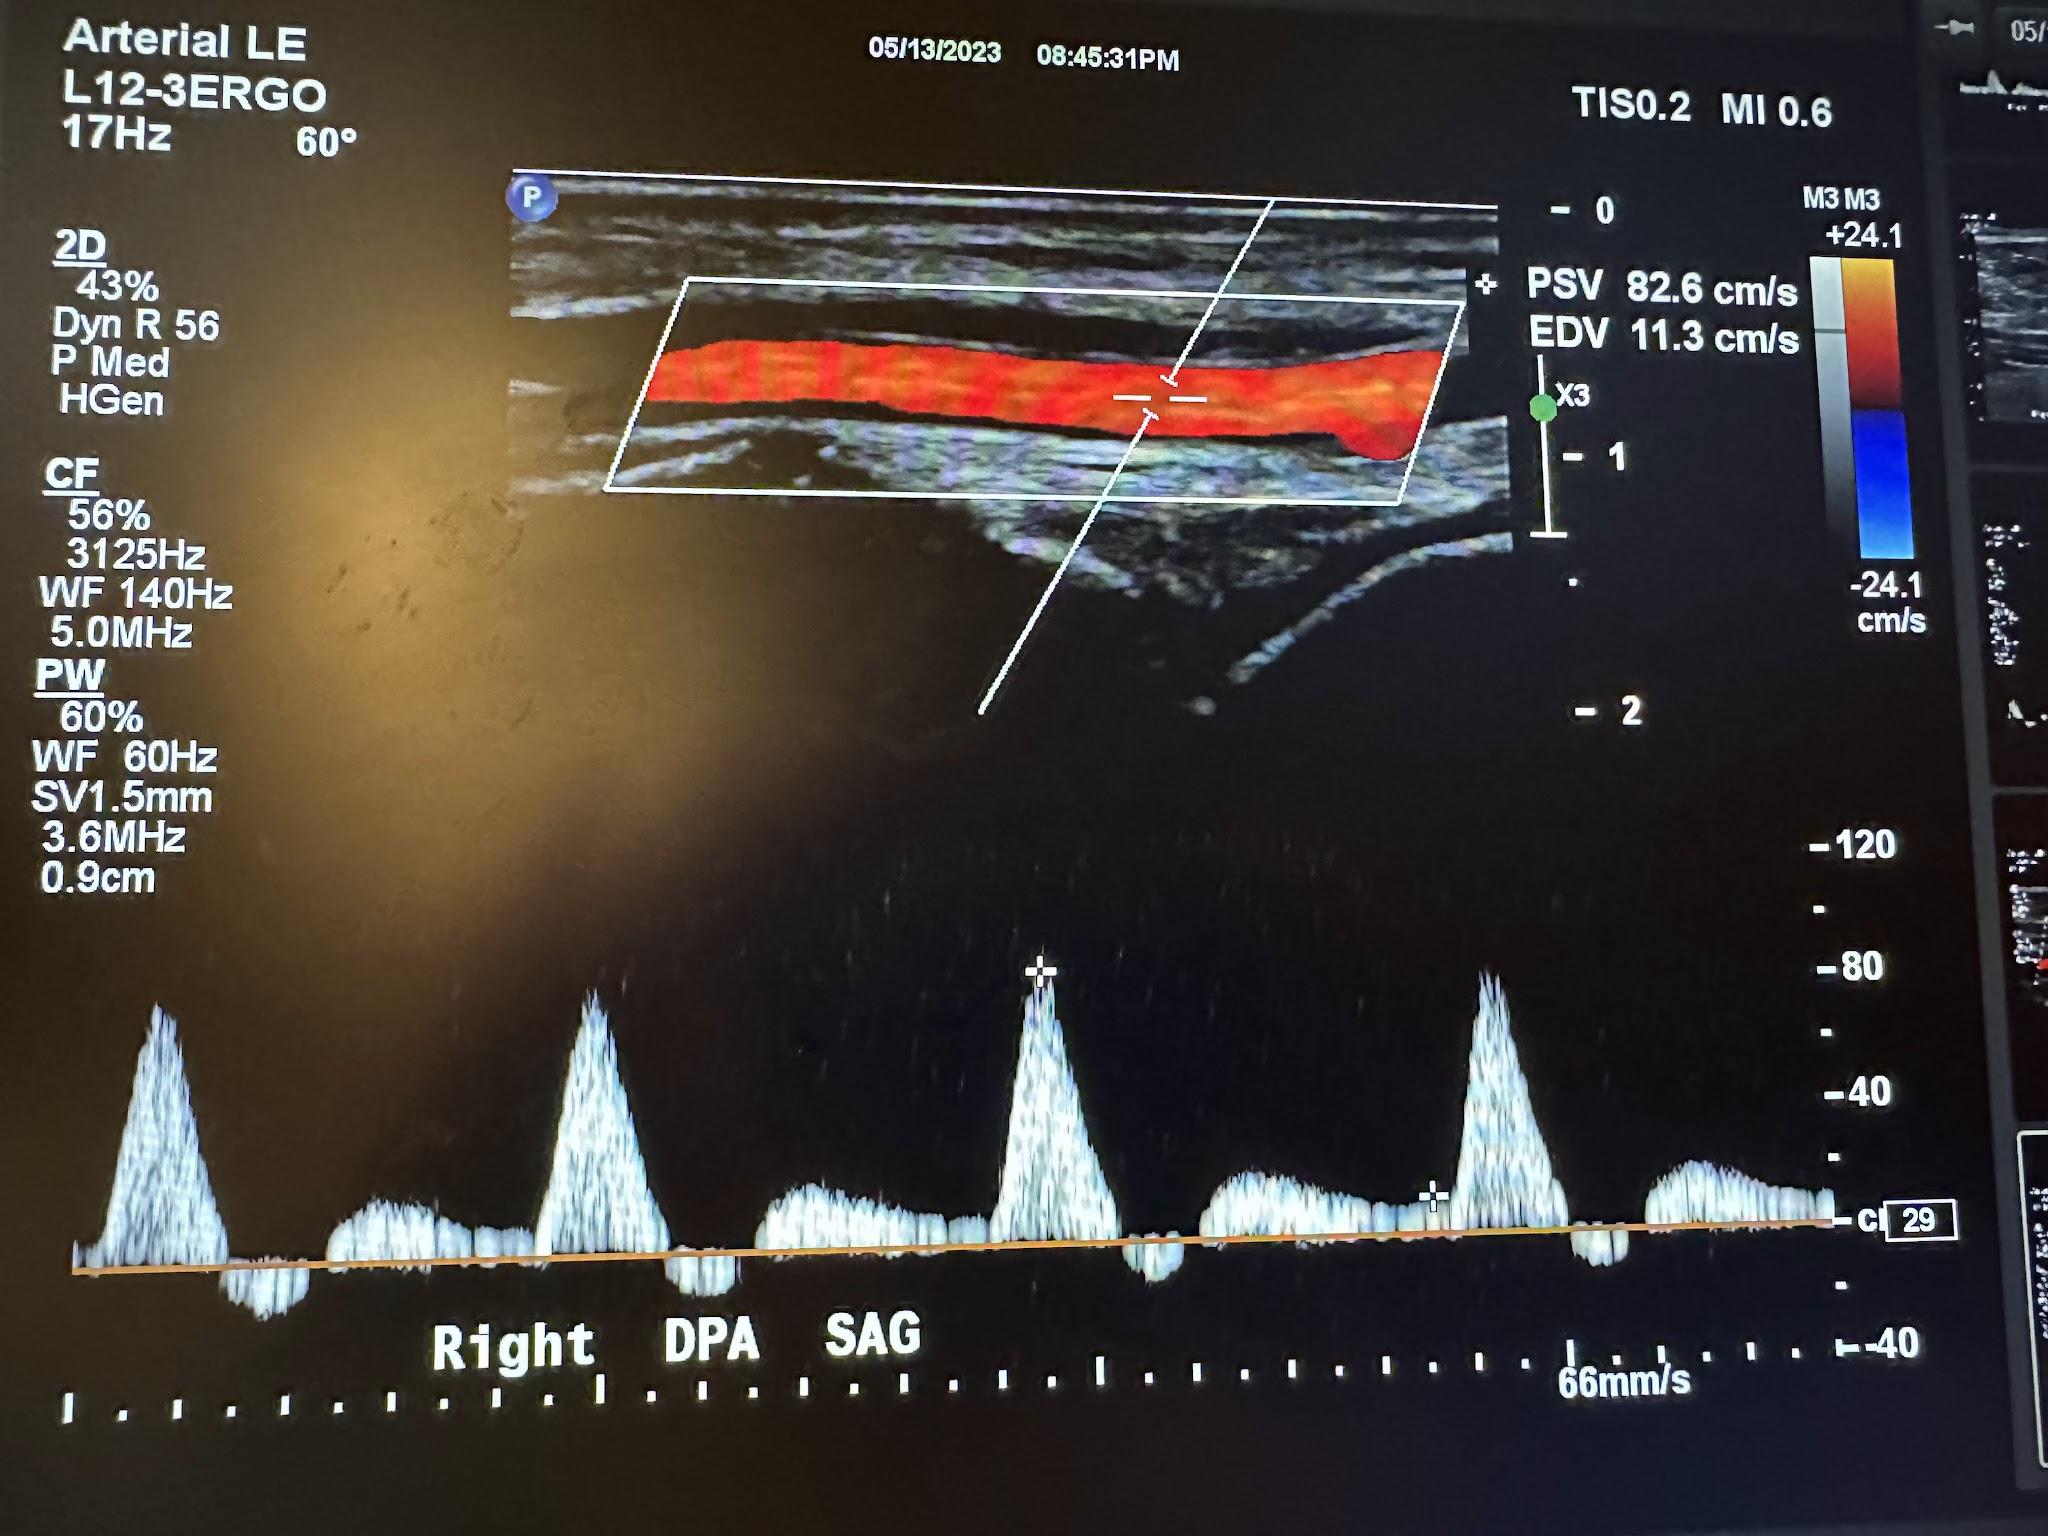
An arterial duplex is another type of evaluation that uses ultrasound. It starts proximally at the common femoral artery with a side-by-side transverse image without and with color Doppler, followed by a sagittal image of the artery in red and sometimes the corresponding vein(s) in blue, and finally, a sagittal image of the artery with waveform analysis, which includes peak systolic velocity (PSV) and end-diastolic velocity (EDV). As the arterial study is performed from proximal to distal, the same approach is obtained with each artery, including, in succession, the common femoral artery (CFA), profunda femoral artery (Prof A), superficial femoral artery (SFA), popliteal artery (Pop A), posterior tibial artery (PTA), peroneal artery (Pero A), anterior tibial artery (ATA), and dorsalis pedis artery (DPA). The abbreviations given in parentheses in the previous sentence have been labeled in some of the ultrasound images discussed below. The abbreviation Trans used in some of these images is for transverse. Figures 10-46 and 10-47 show the transverse and sagittal views, respectively, of the side-by-side images of the right common femoral artery without and with color Doppler. Figure 10-48 shows the sagittal view of the right common femoral artery with color Doppler and waveform analysis.
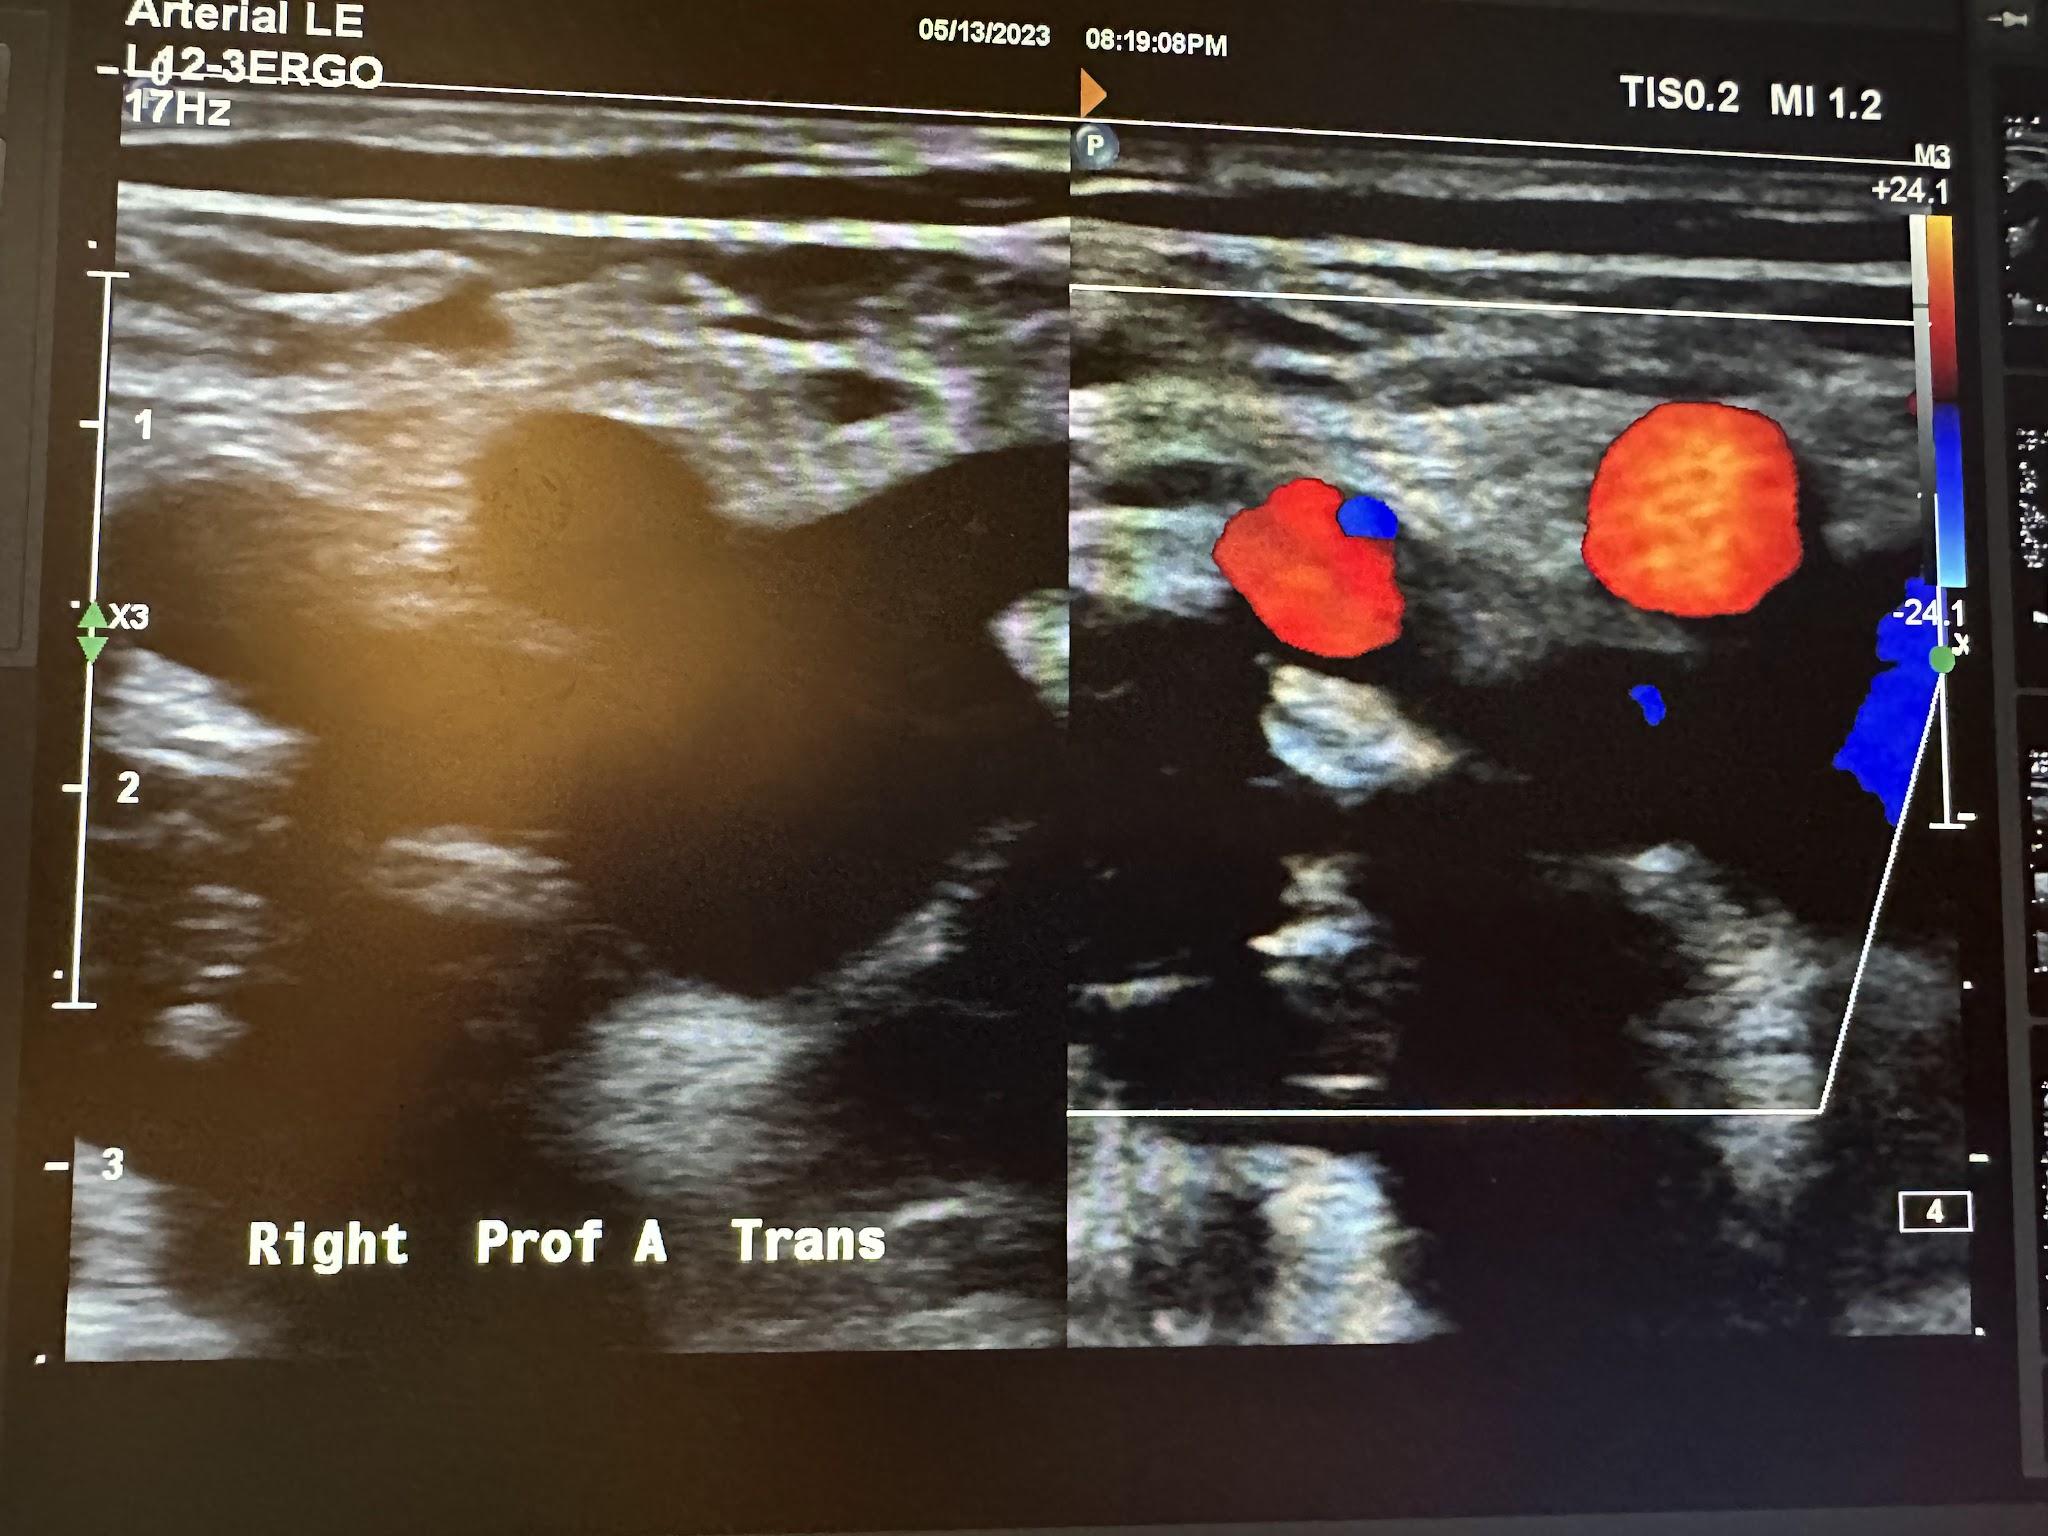
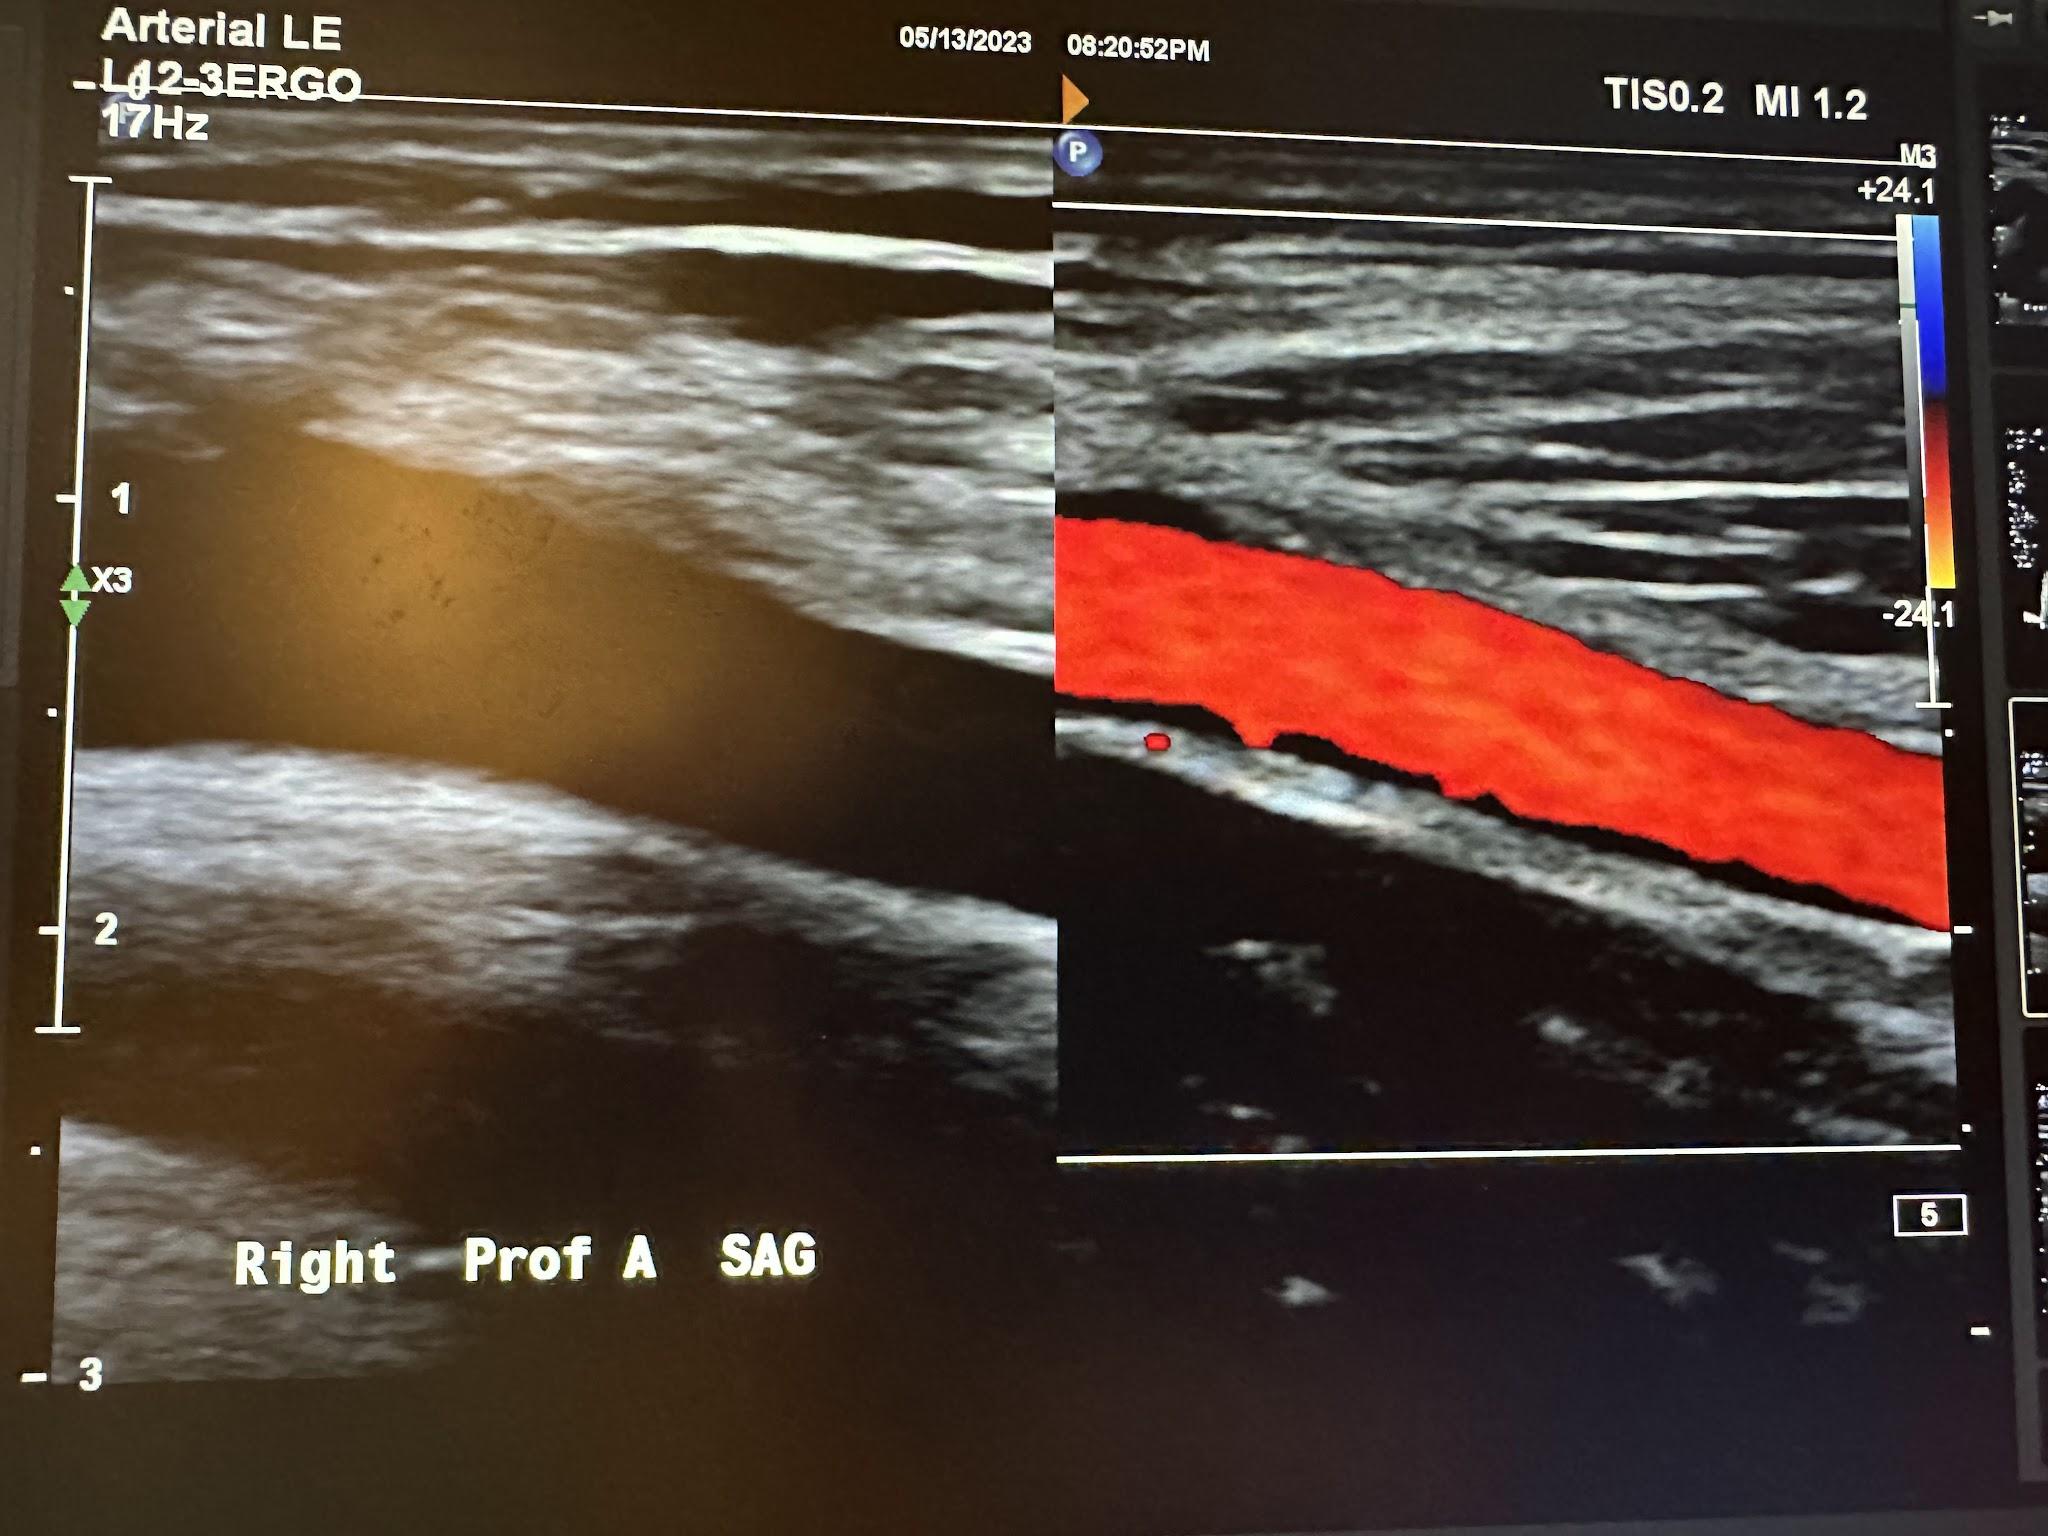
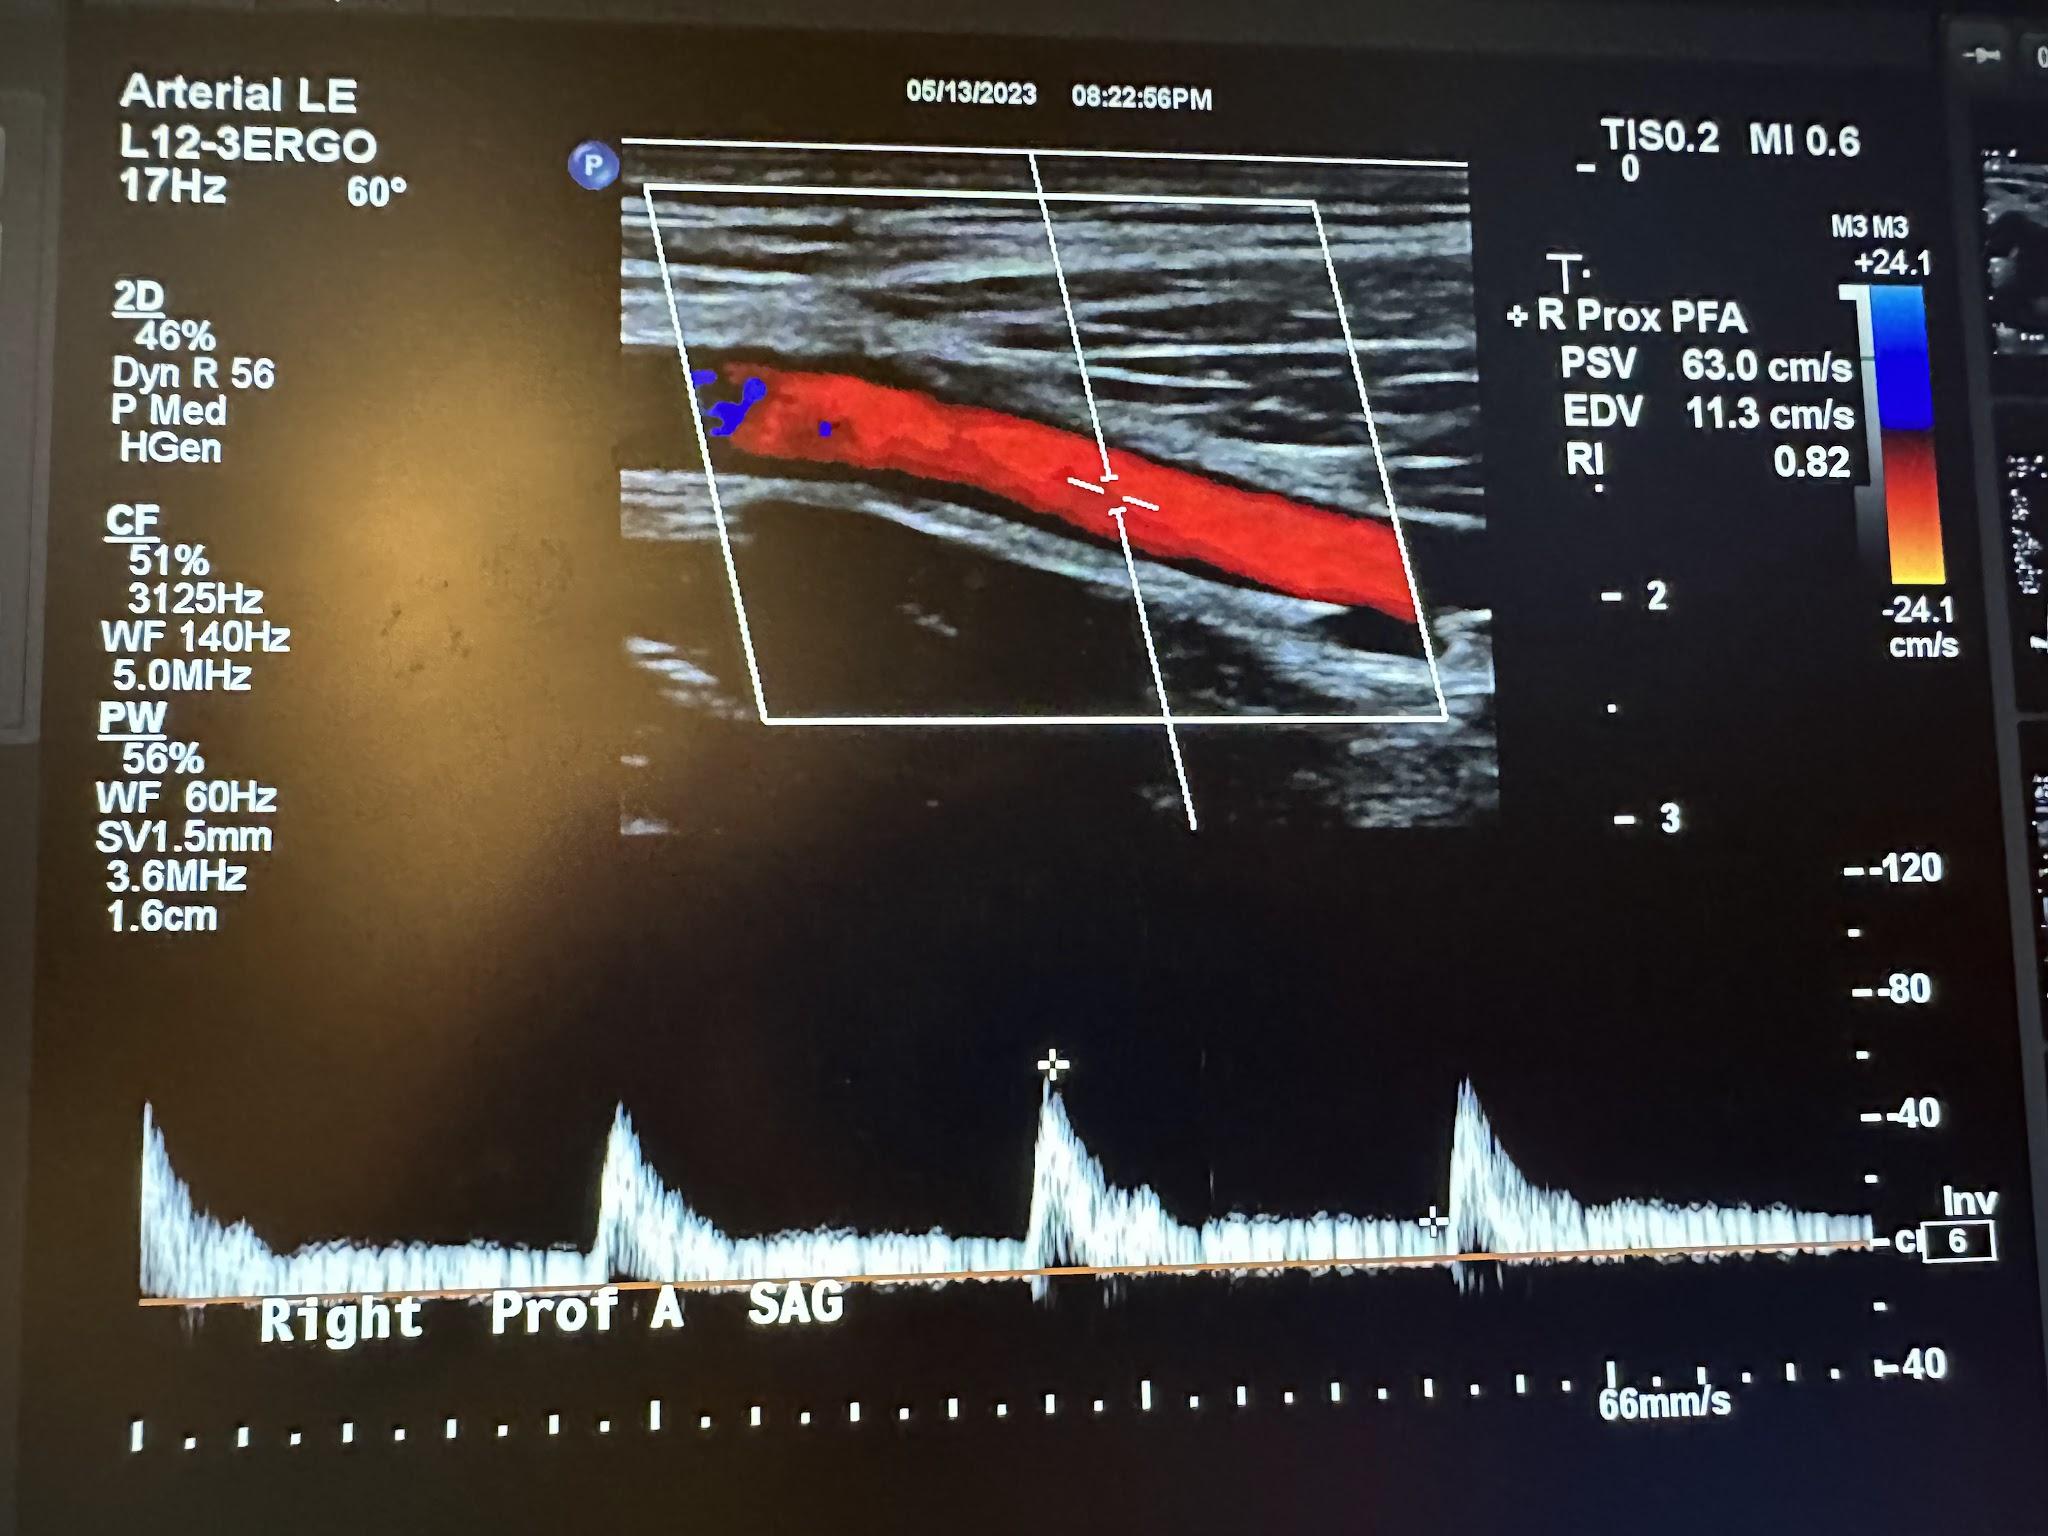
Figures 10-49 and 10-50 show the transverse and sagittal views, respectively, of the right profunda femoral artery without and with color Doppler. Figure 10-51 shows the sagittal view of the right profunda femoral artery with color Doppler and waveform analysis.
Figures 10-52 and 10-53 show the transverse and sagittal views, respectively, of the right proximal superficial femoral artery without and with color Doppler. Figure 10-54 shows the sagittal view of the right proximal superficial femoral artery with color Doppler and waveform analysis.
Figures 10-55 and 10-56 show the transverse and sagittal views, respectively, of the right middle superficial femoral artery without and with color Doppler. Figure 10-57 shows the sagittal view of the right middle superficial femoral artery with color Doppler and waveform analysis.
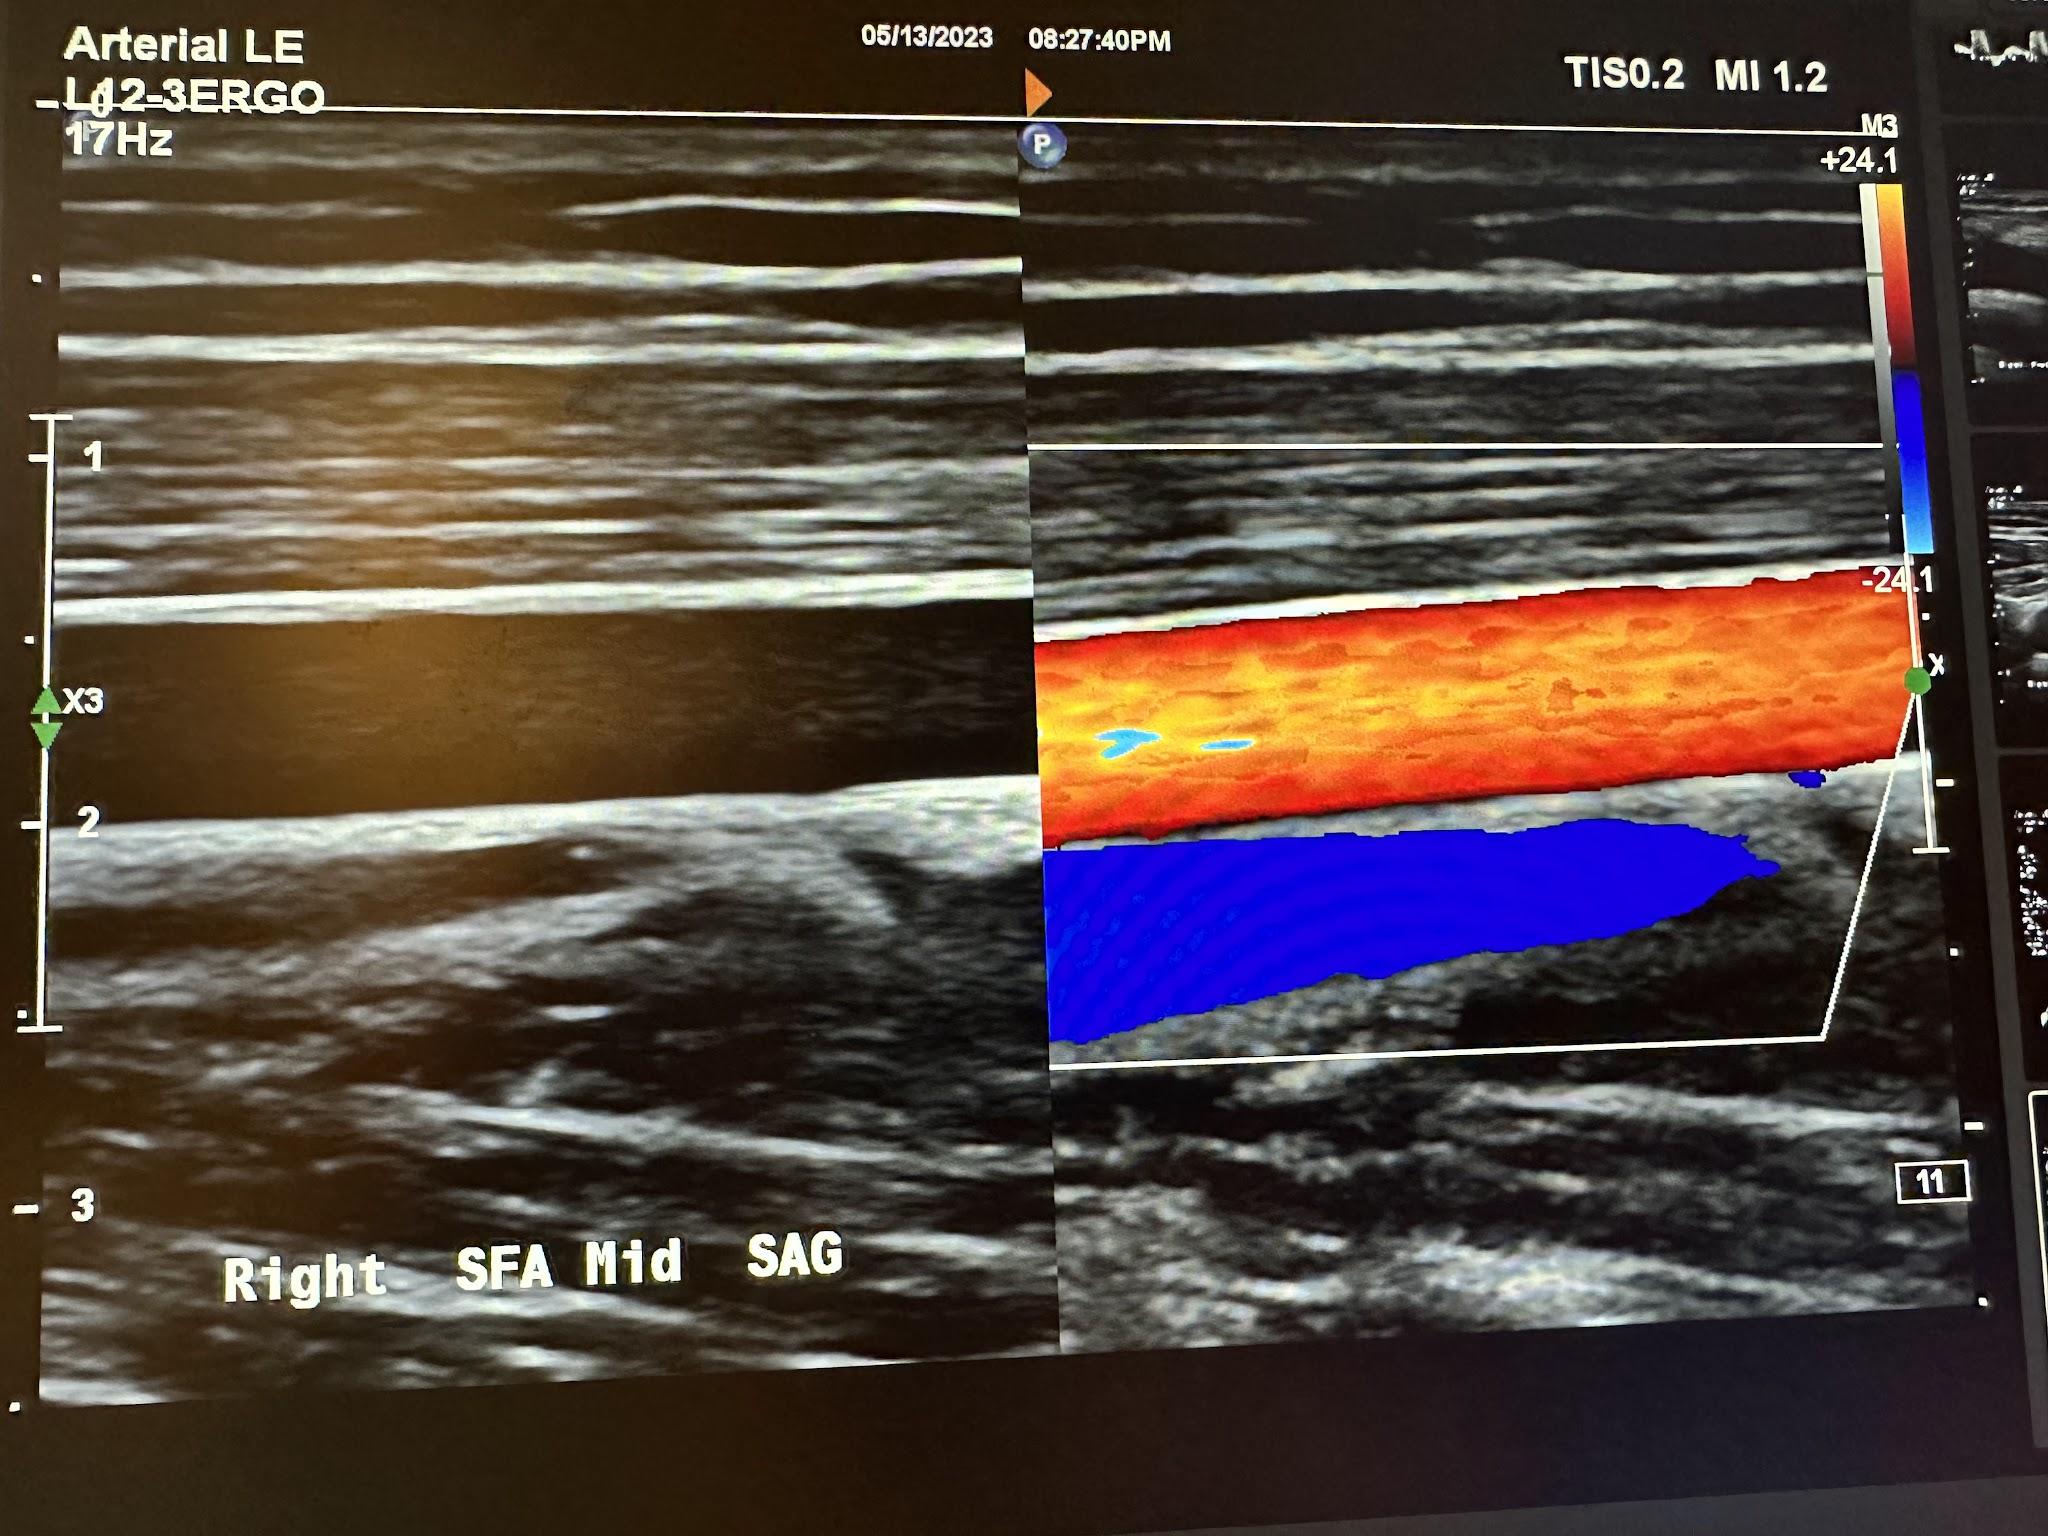
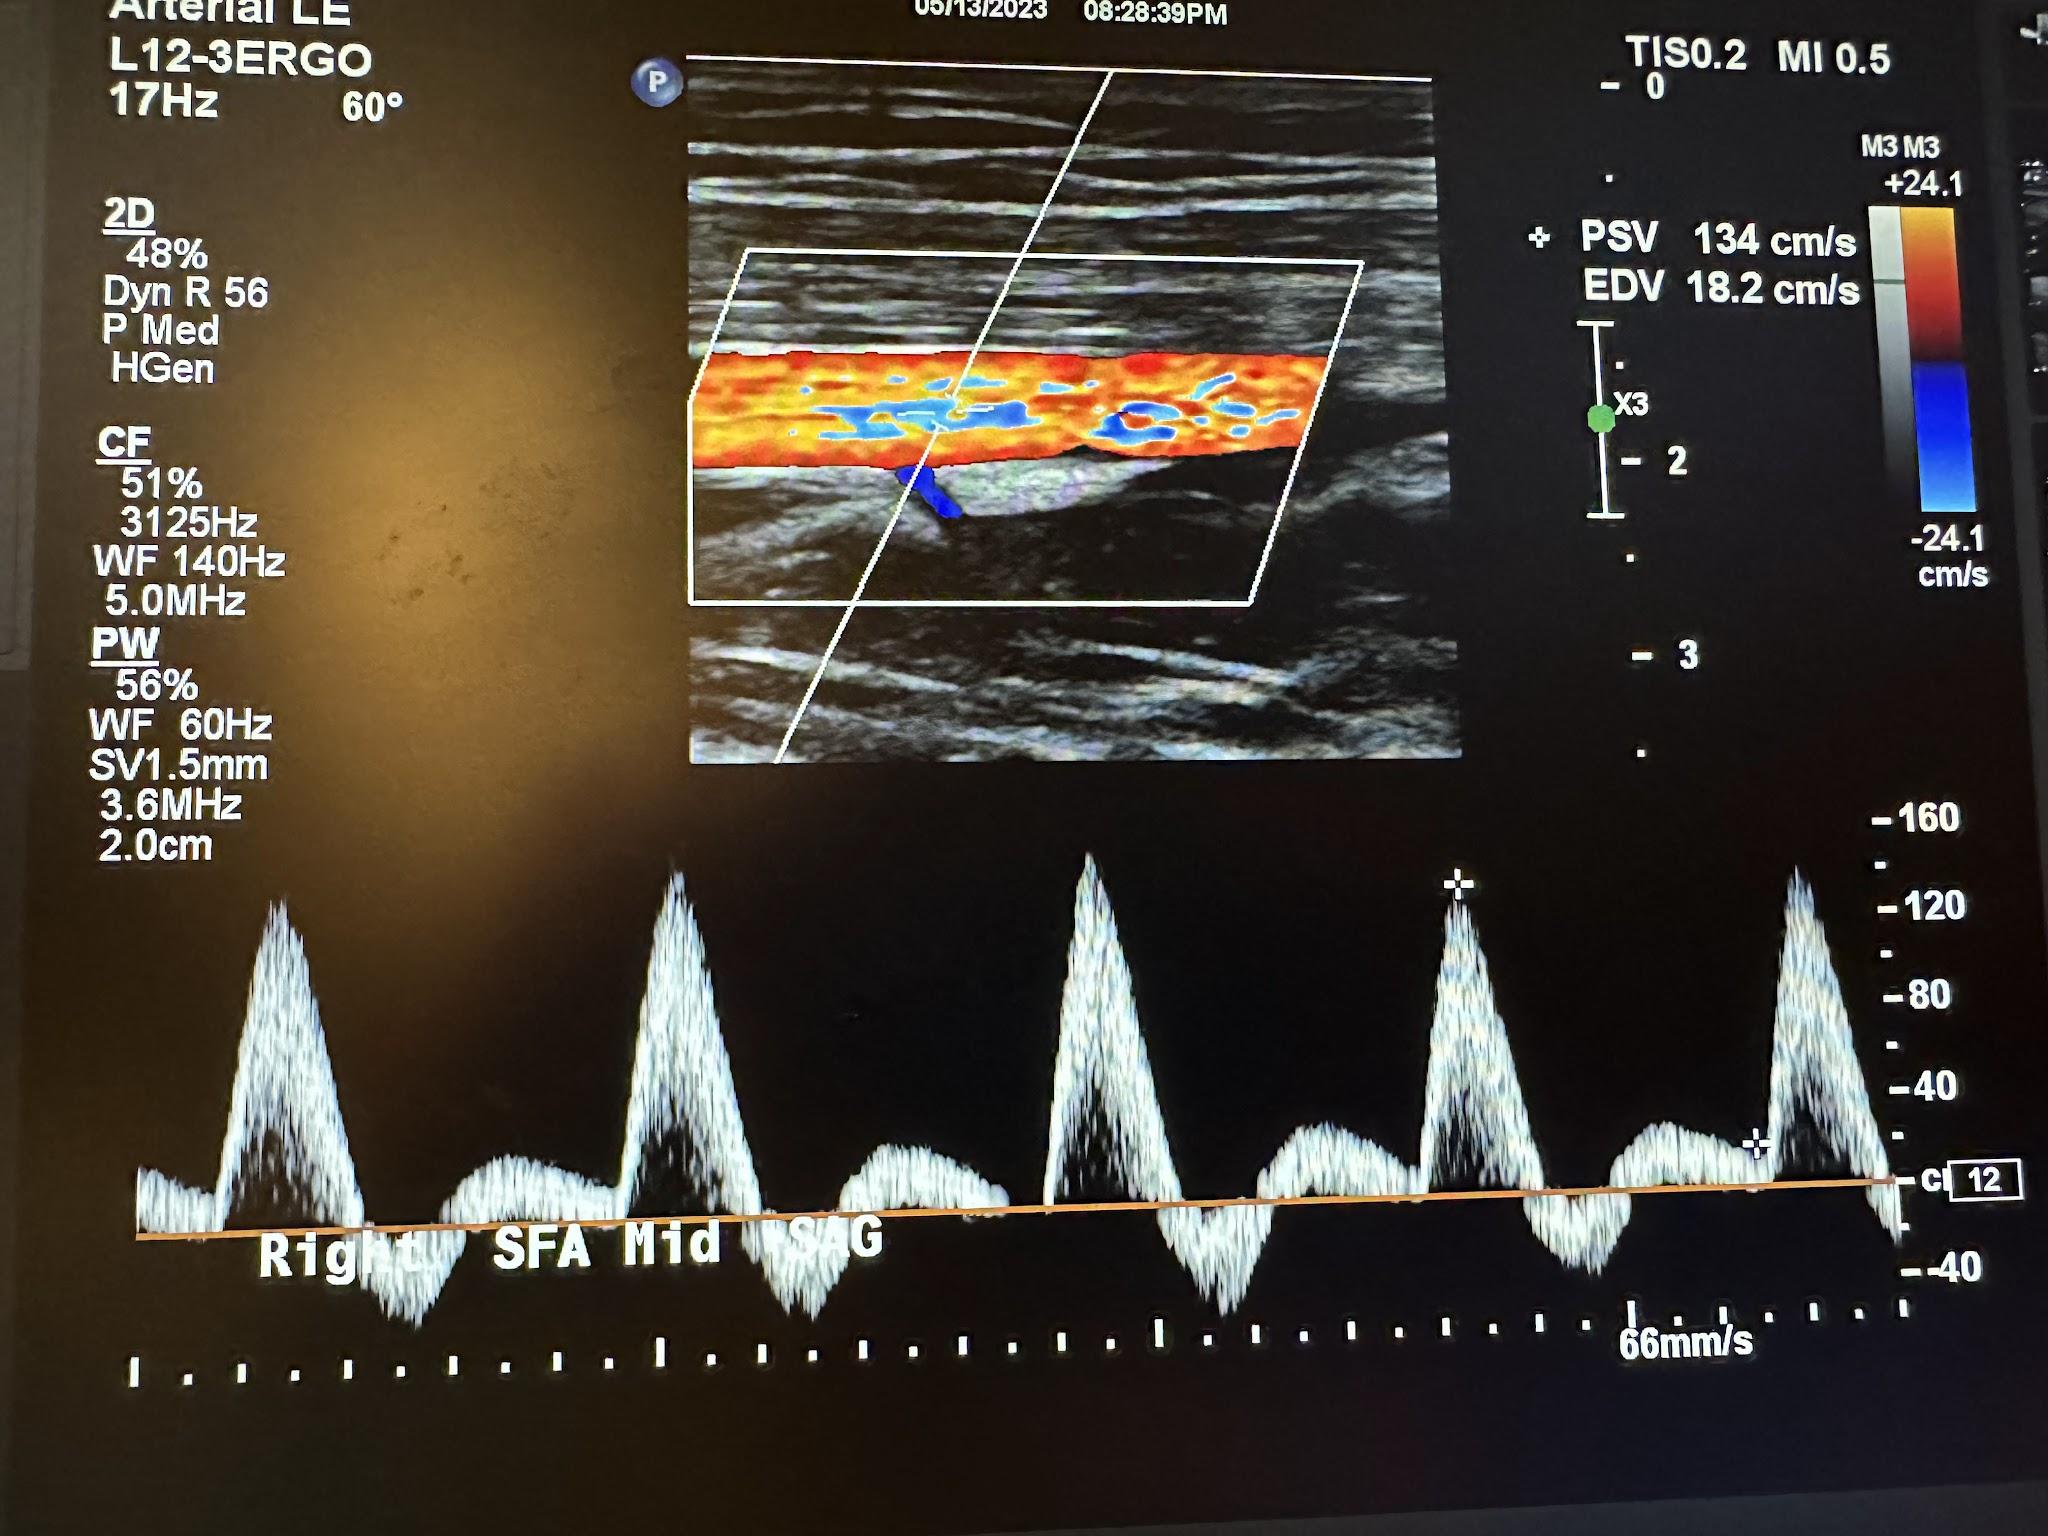
Figures 10-58 and 10-59 show the transverse and sagittal views of the right distal superficial femoral artery without and with color Doppler. Figure 10-60 shows the sagittal view of the right distal superficial femoral artery with color Doppler and waveform analysis.
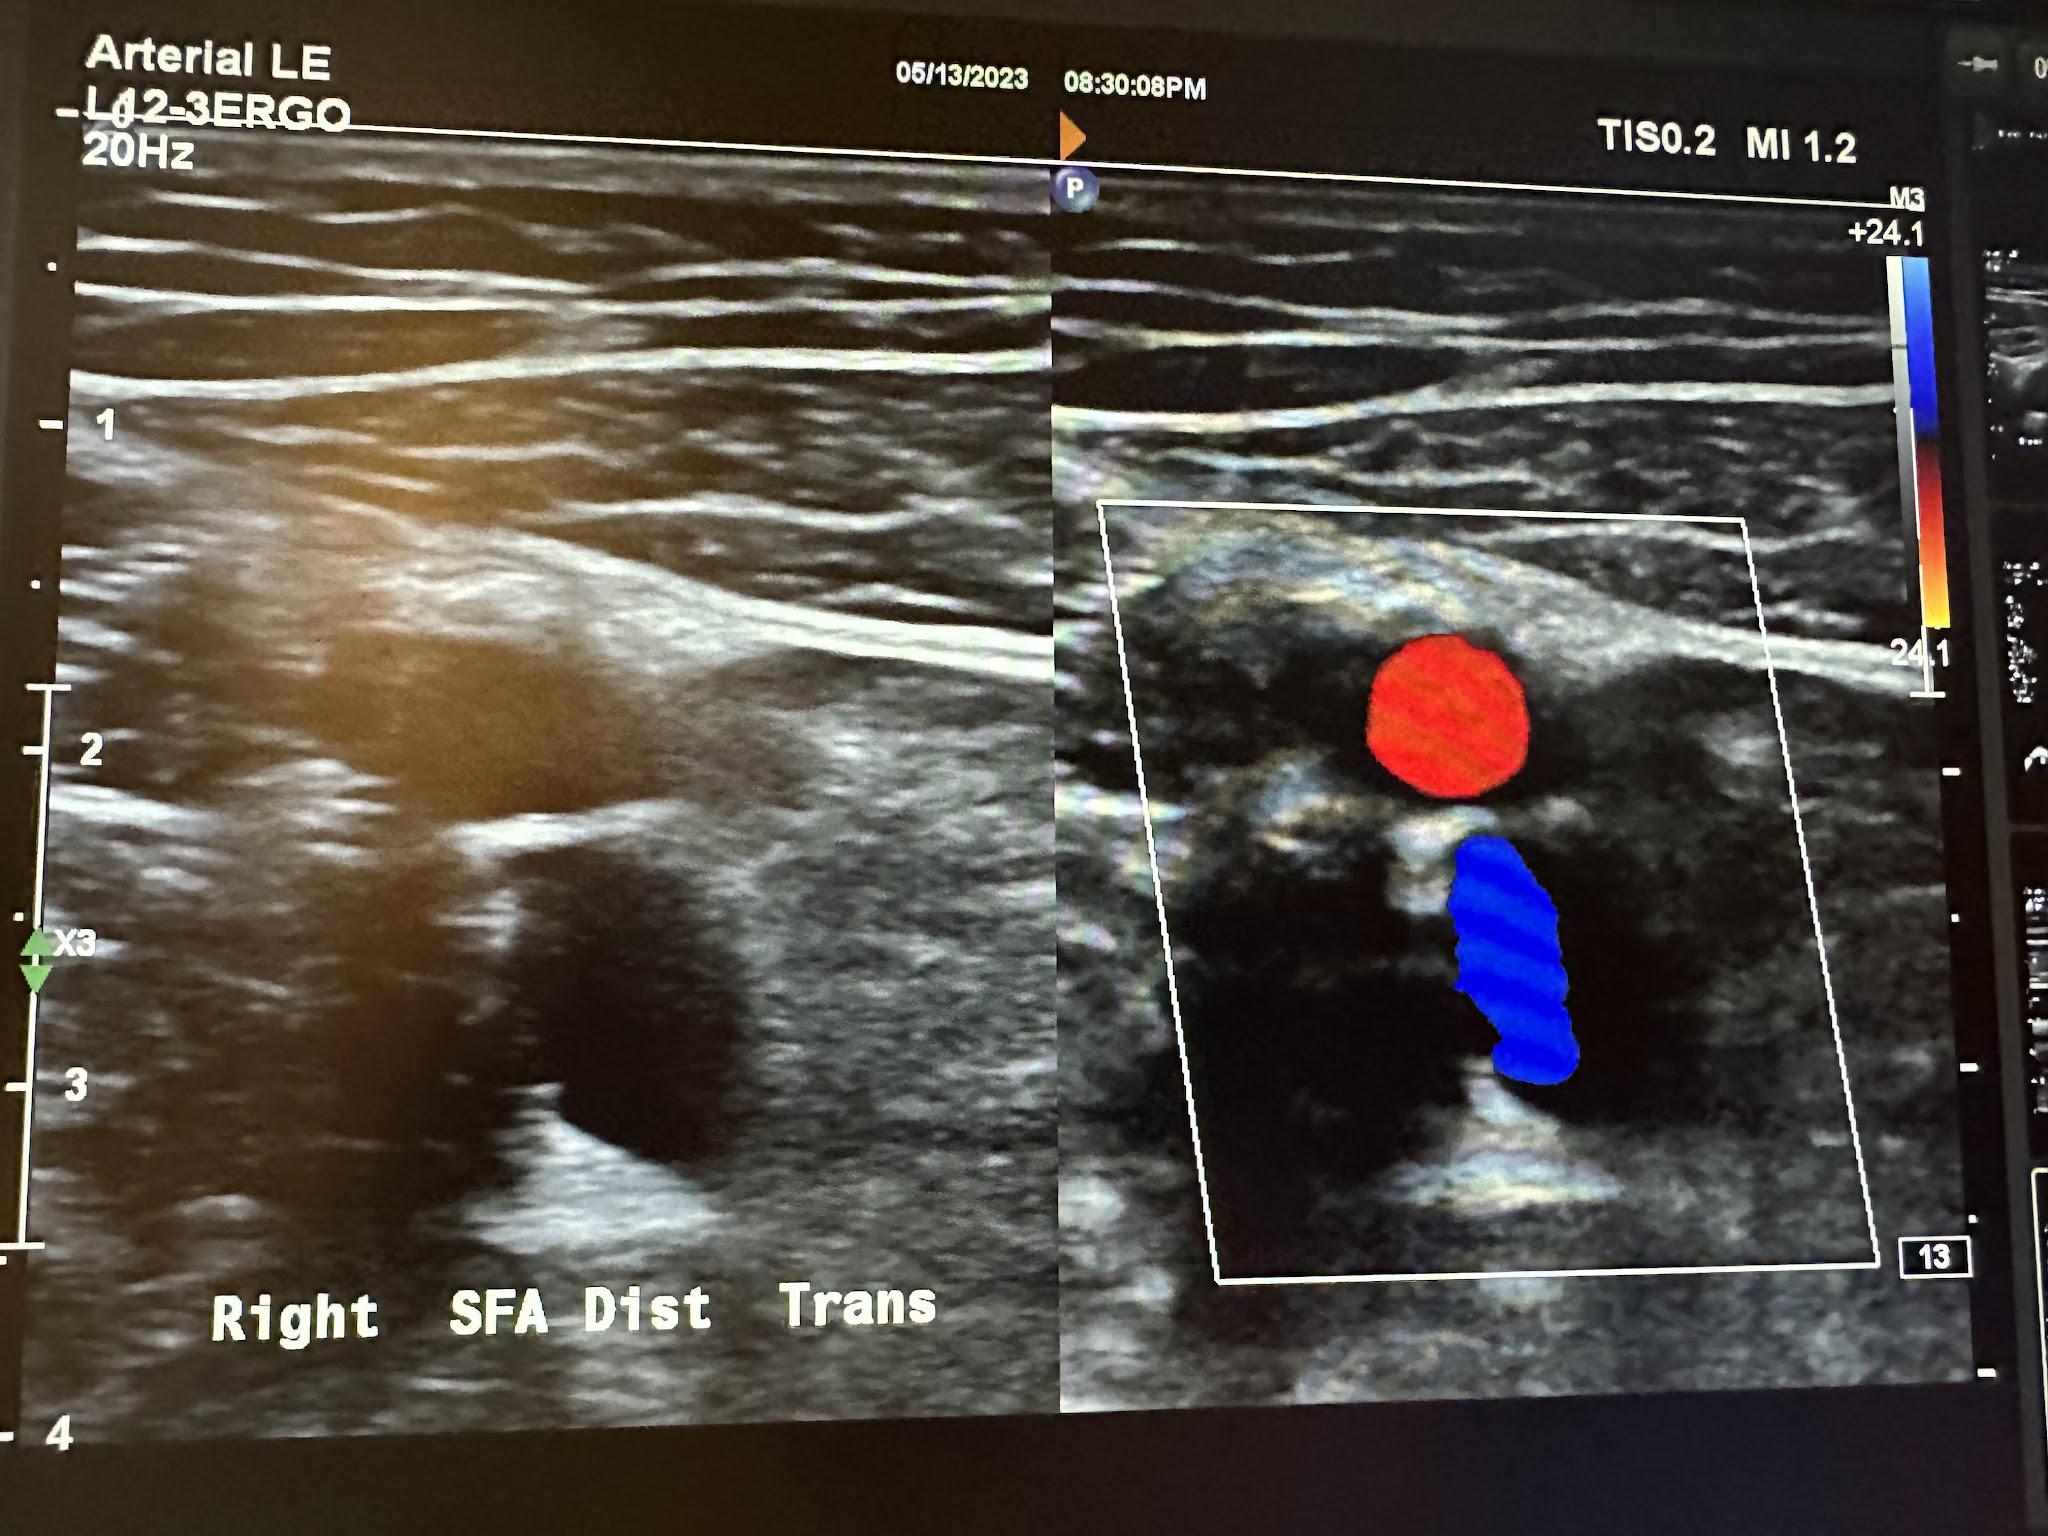
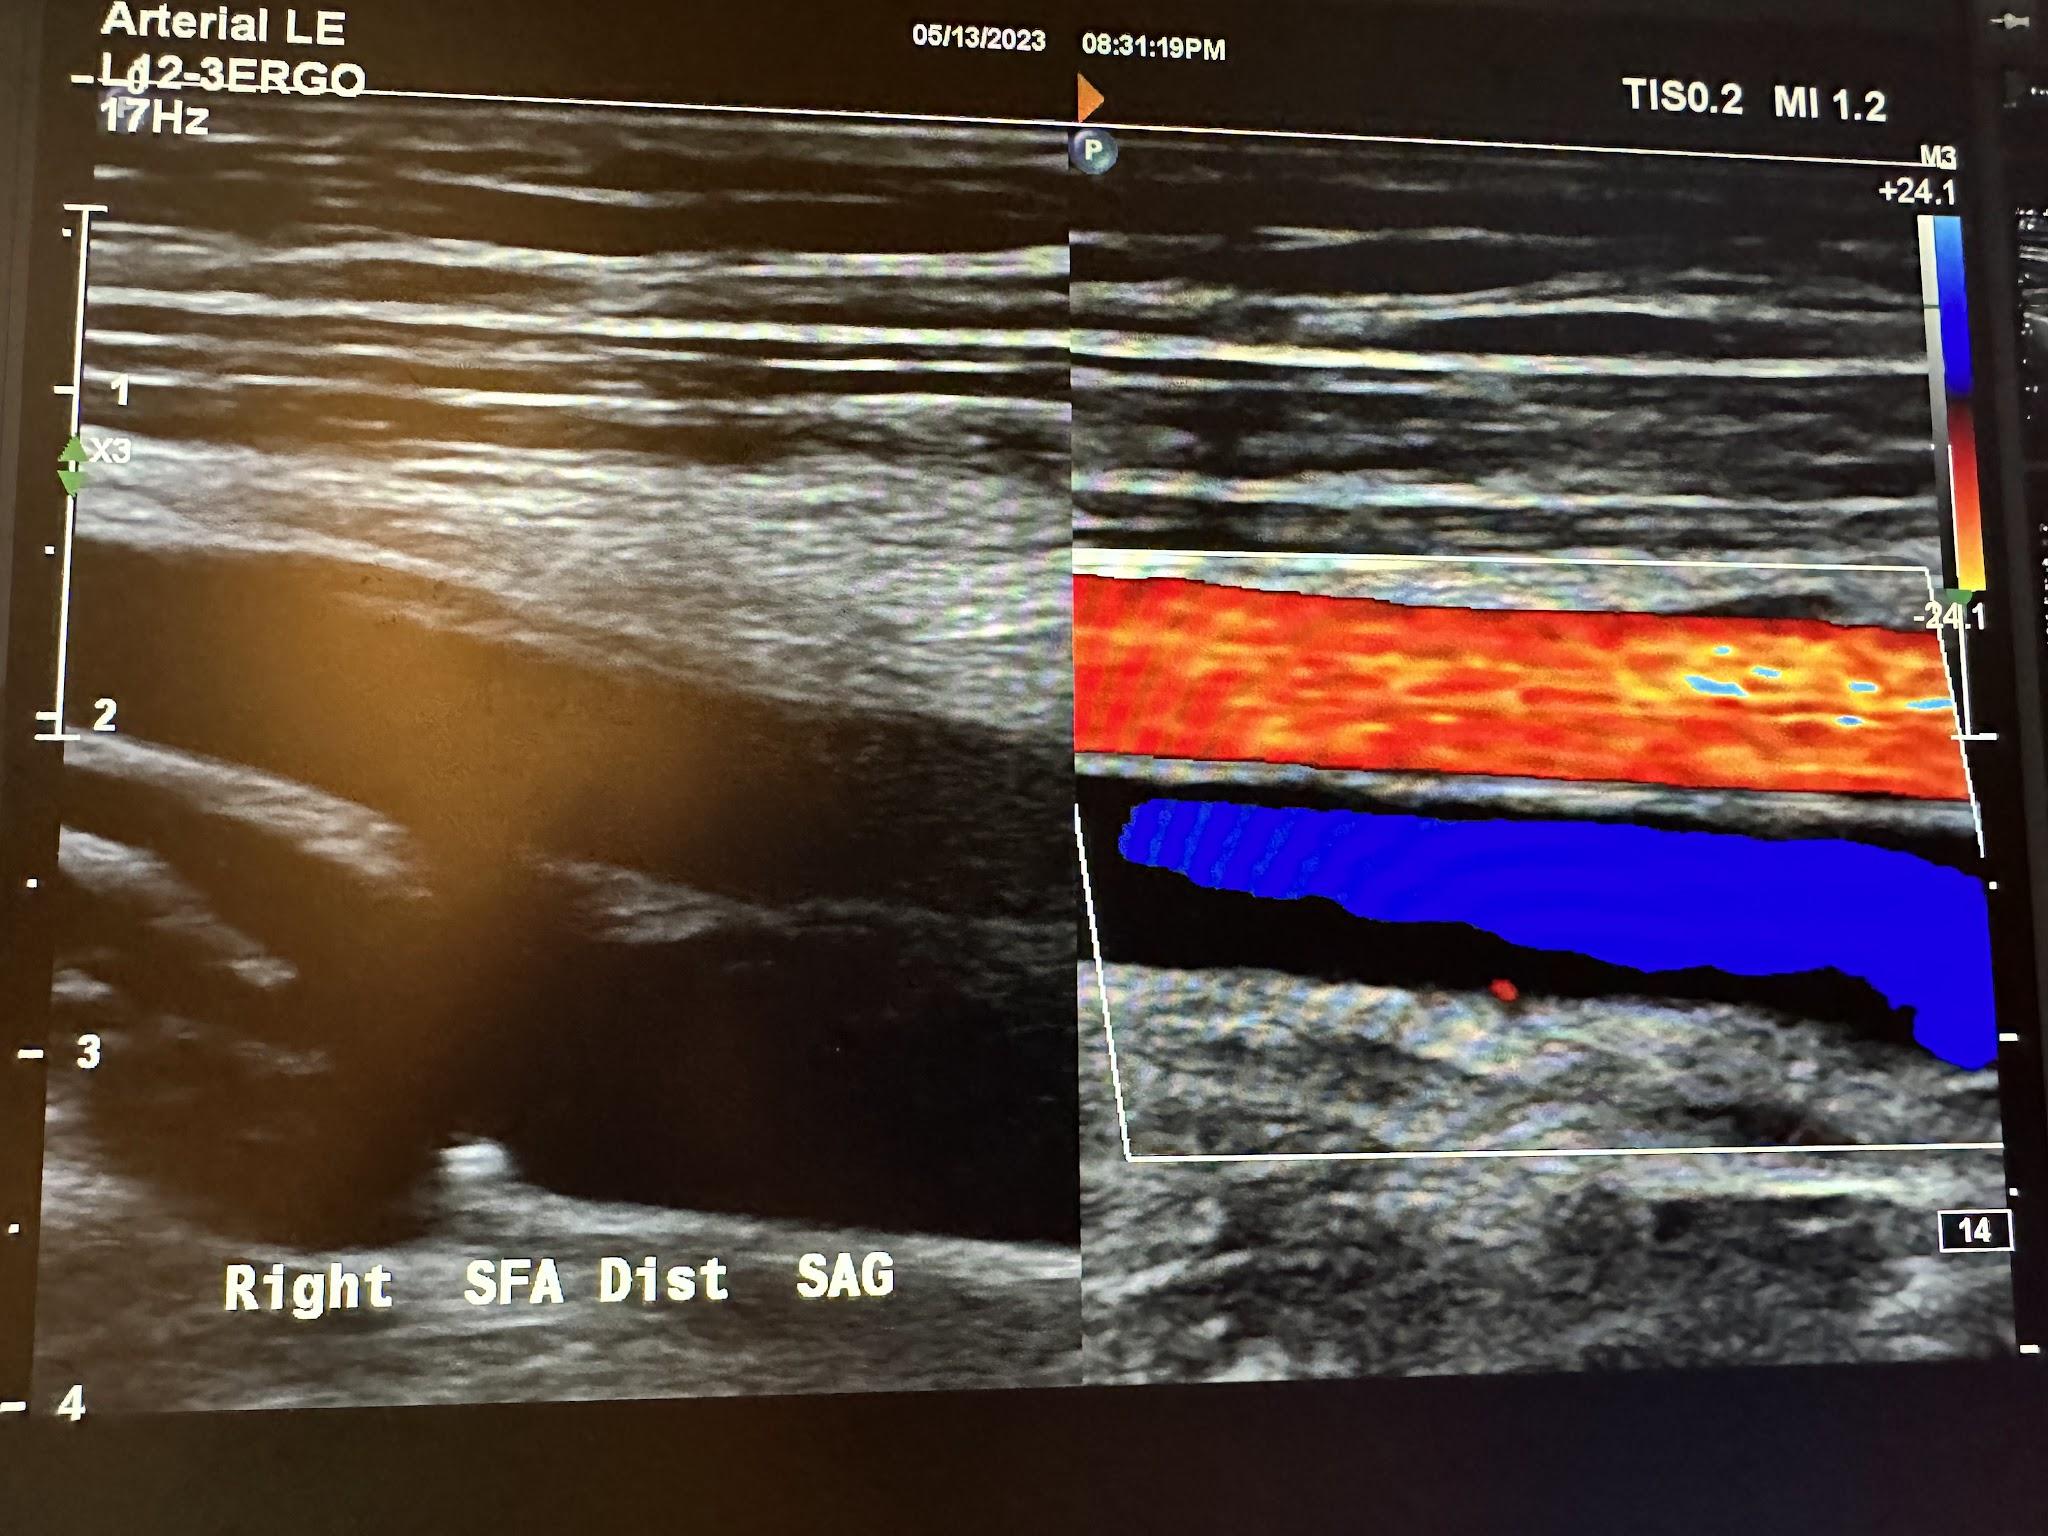
Figures 10-61 and 10-62 show the transverse and sagittal views, respectively, of the right popliteal artery without and with color Doppler. Figure 10-63 shows the sagittal view of the right popliteal artery with color Doppler and waveform analysis.
Figures 10-64 and 10-65 show the transverse and sagittal views, respectively, of the right posterior tibial artery without and with color Doppler. Figure 10-66 shows the sagittal view of the right posterior tibial artery with color Doppler and waveform analysis.

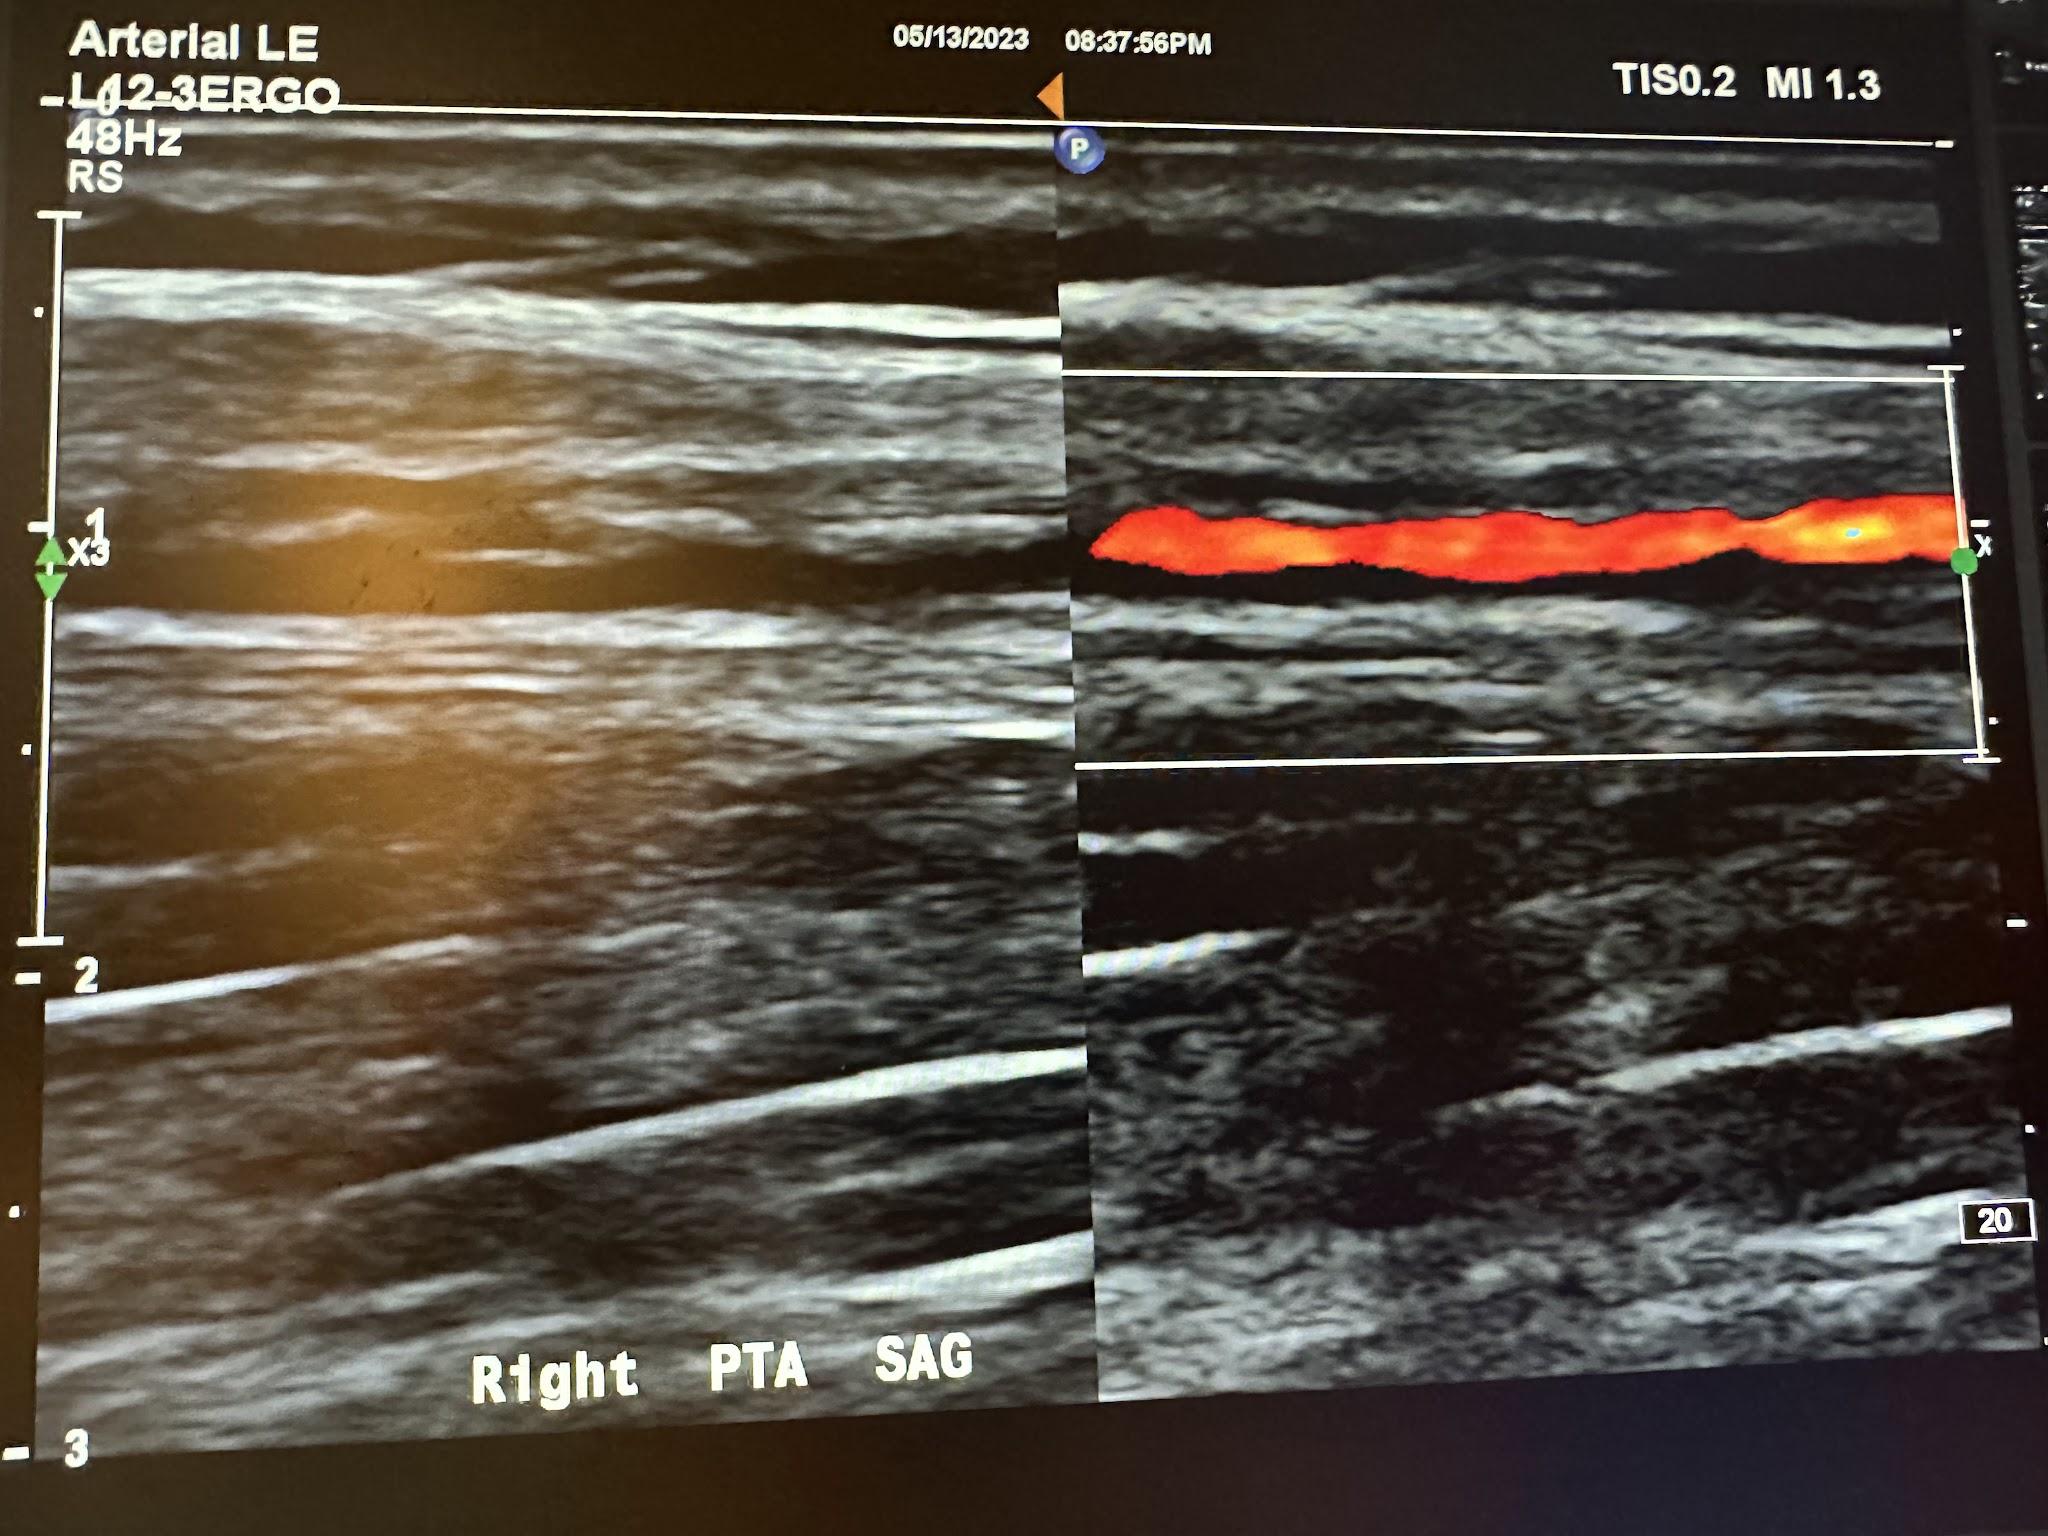
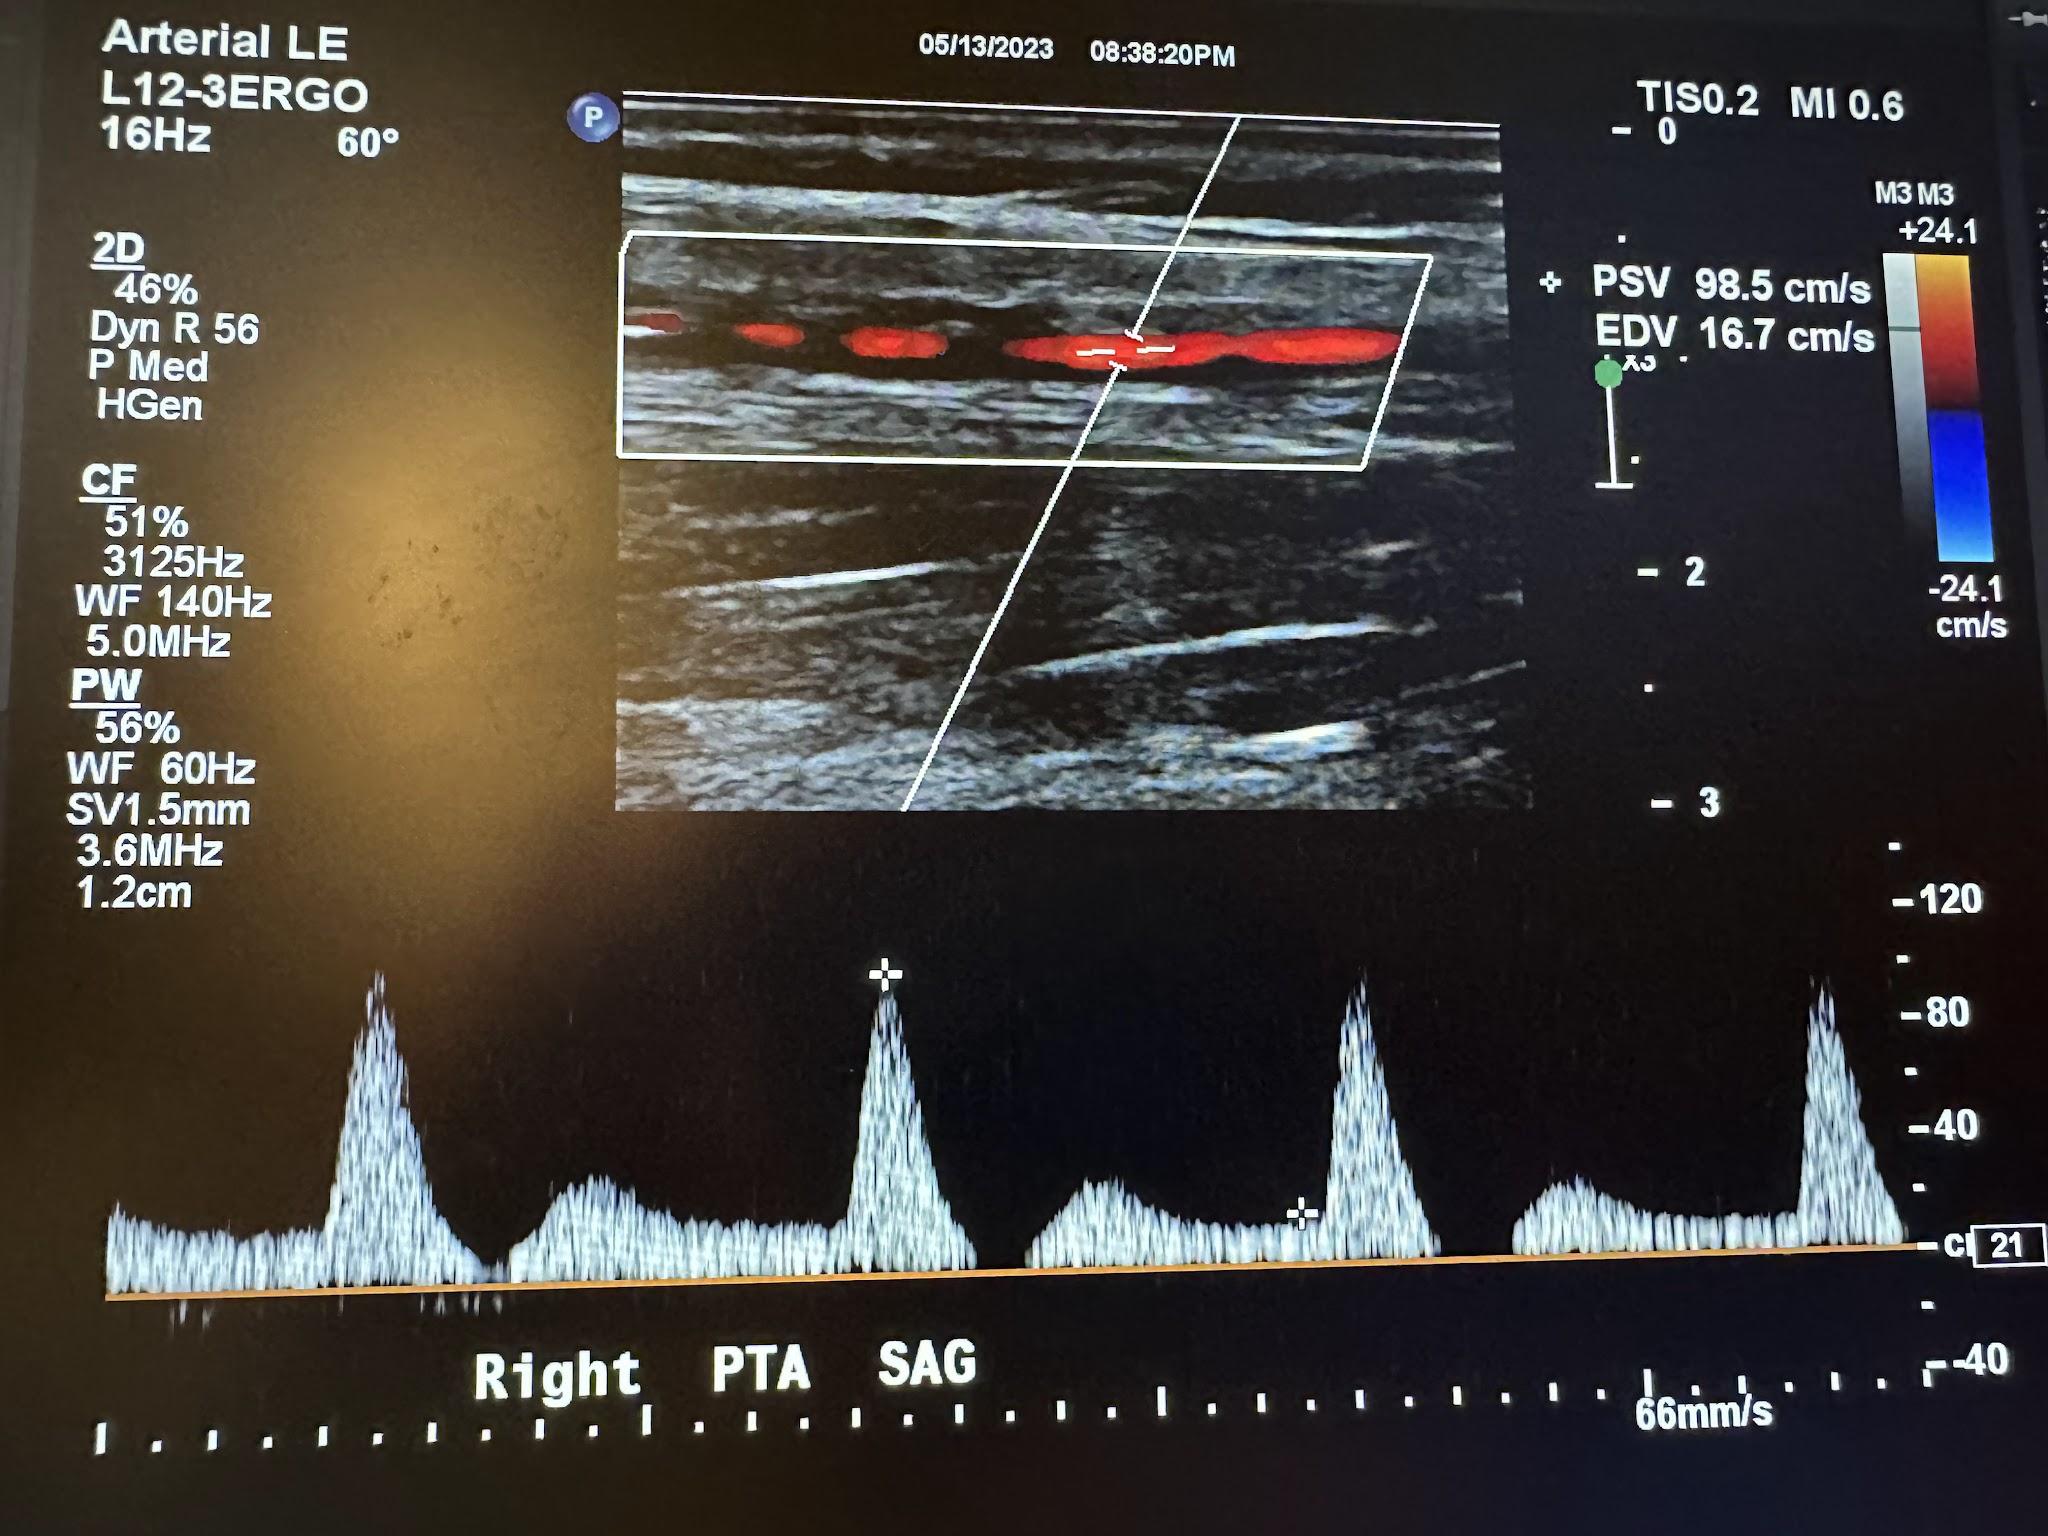
Figures 10-67 and 10-68 show the transverse and sagittal views, respectively, of the right peroneal artery without and with color Doppler. Figure 10-69 shows the sagittal view of the right peroneal artery with color Doppler and waveform analysis.
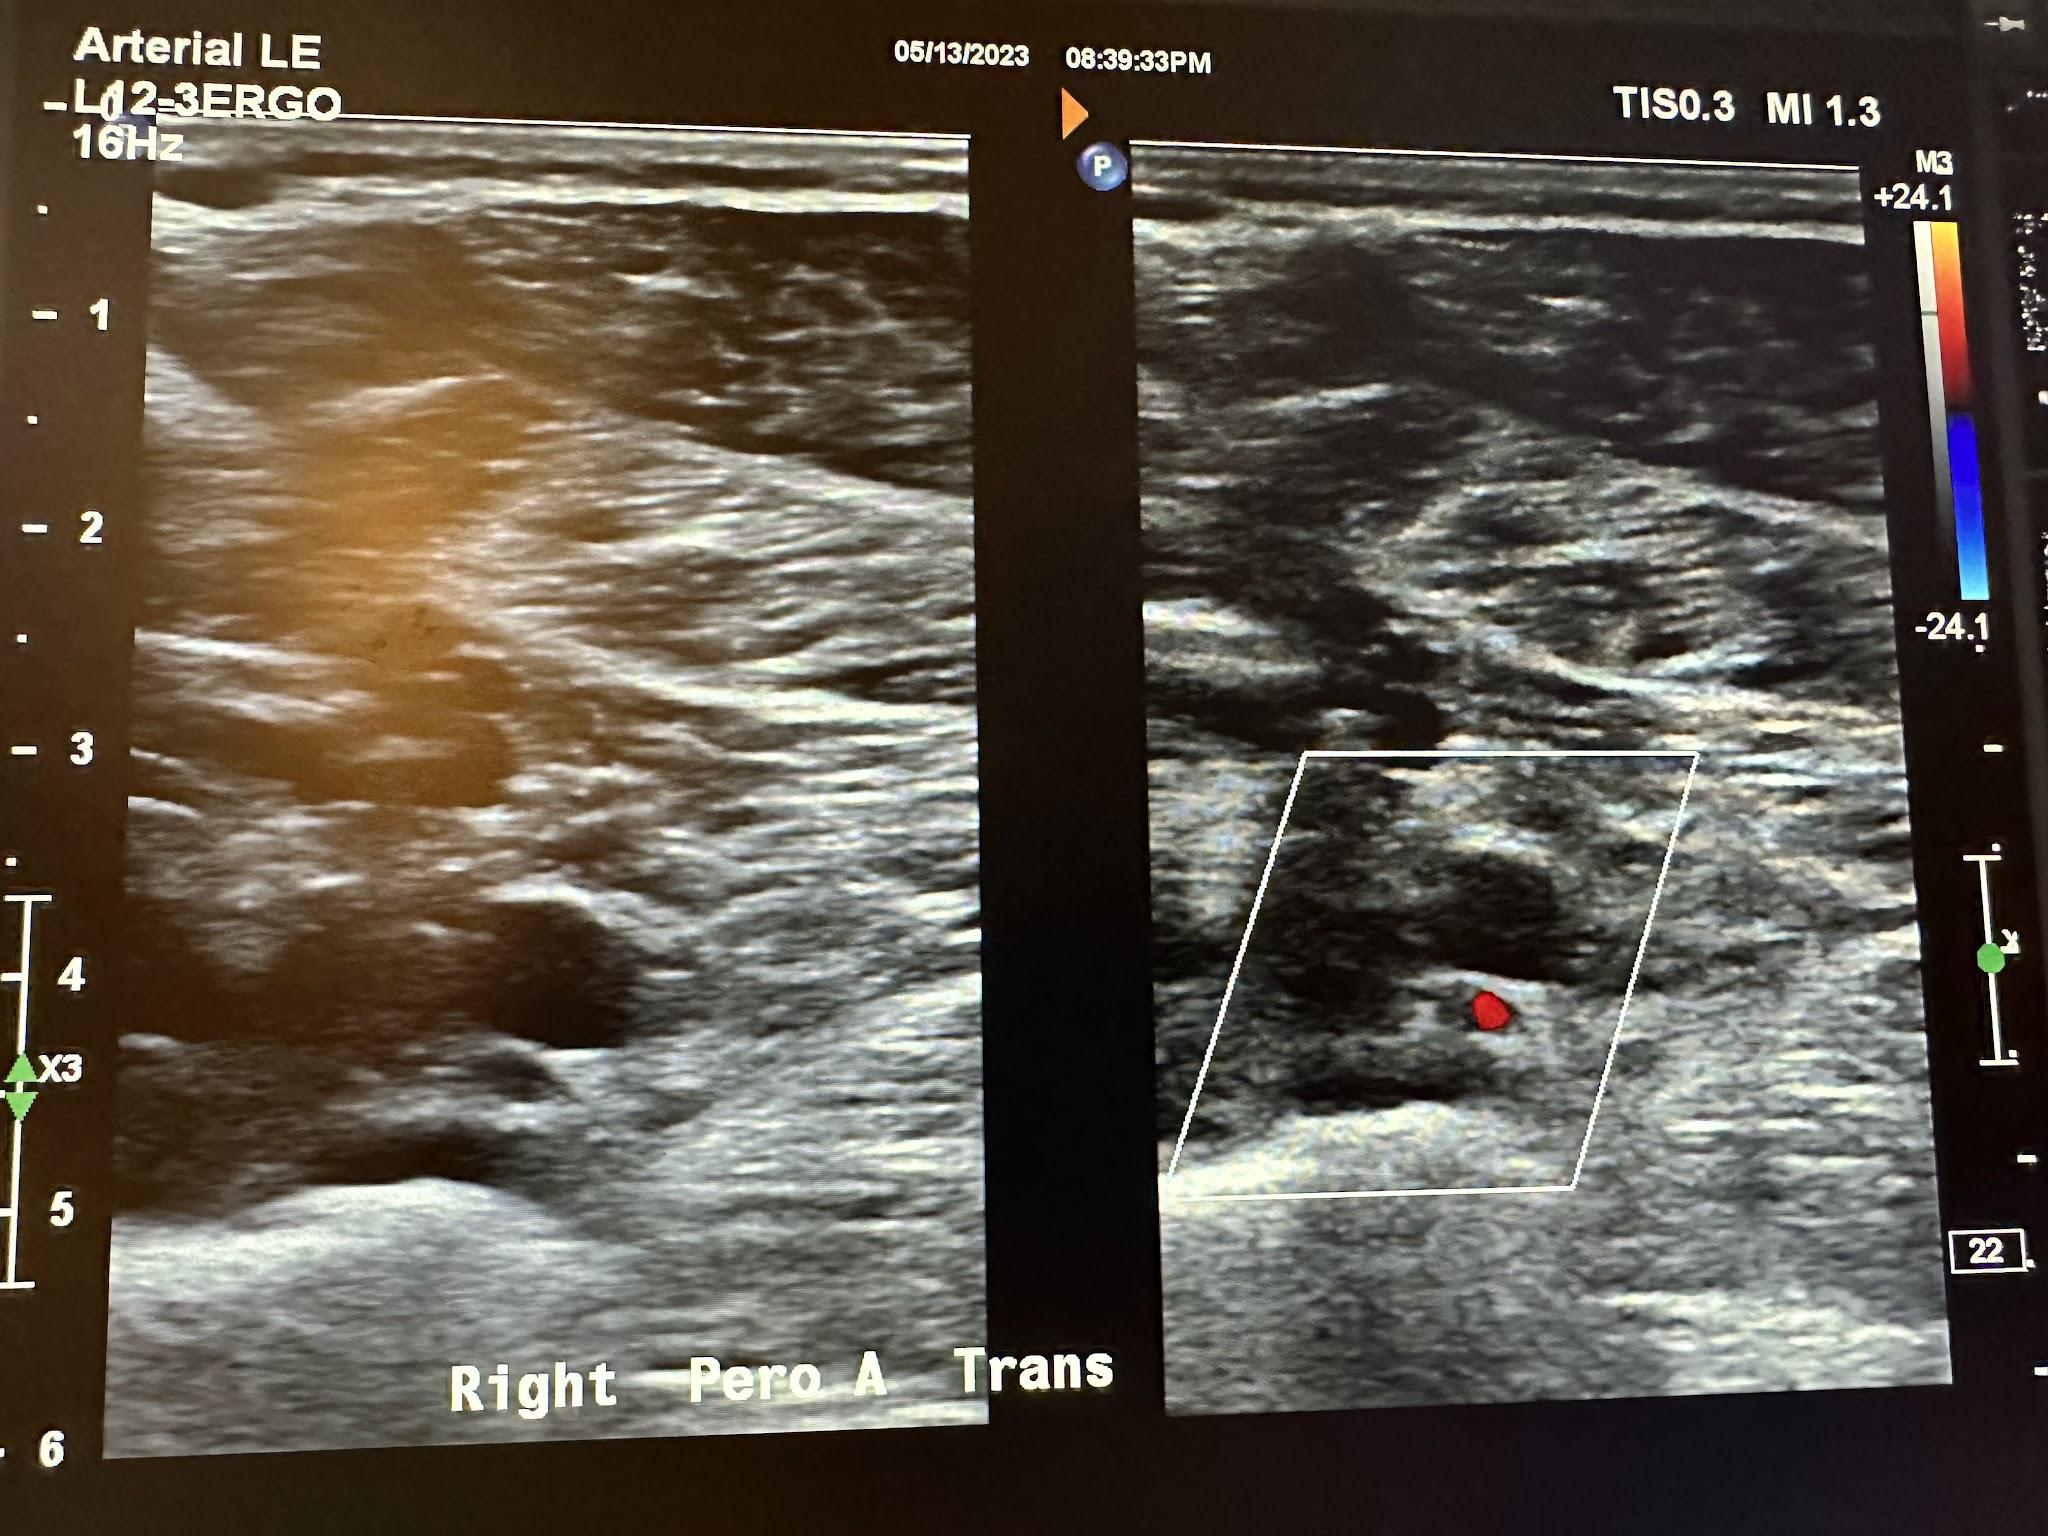
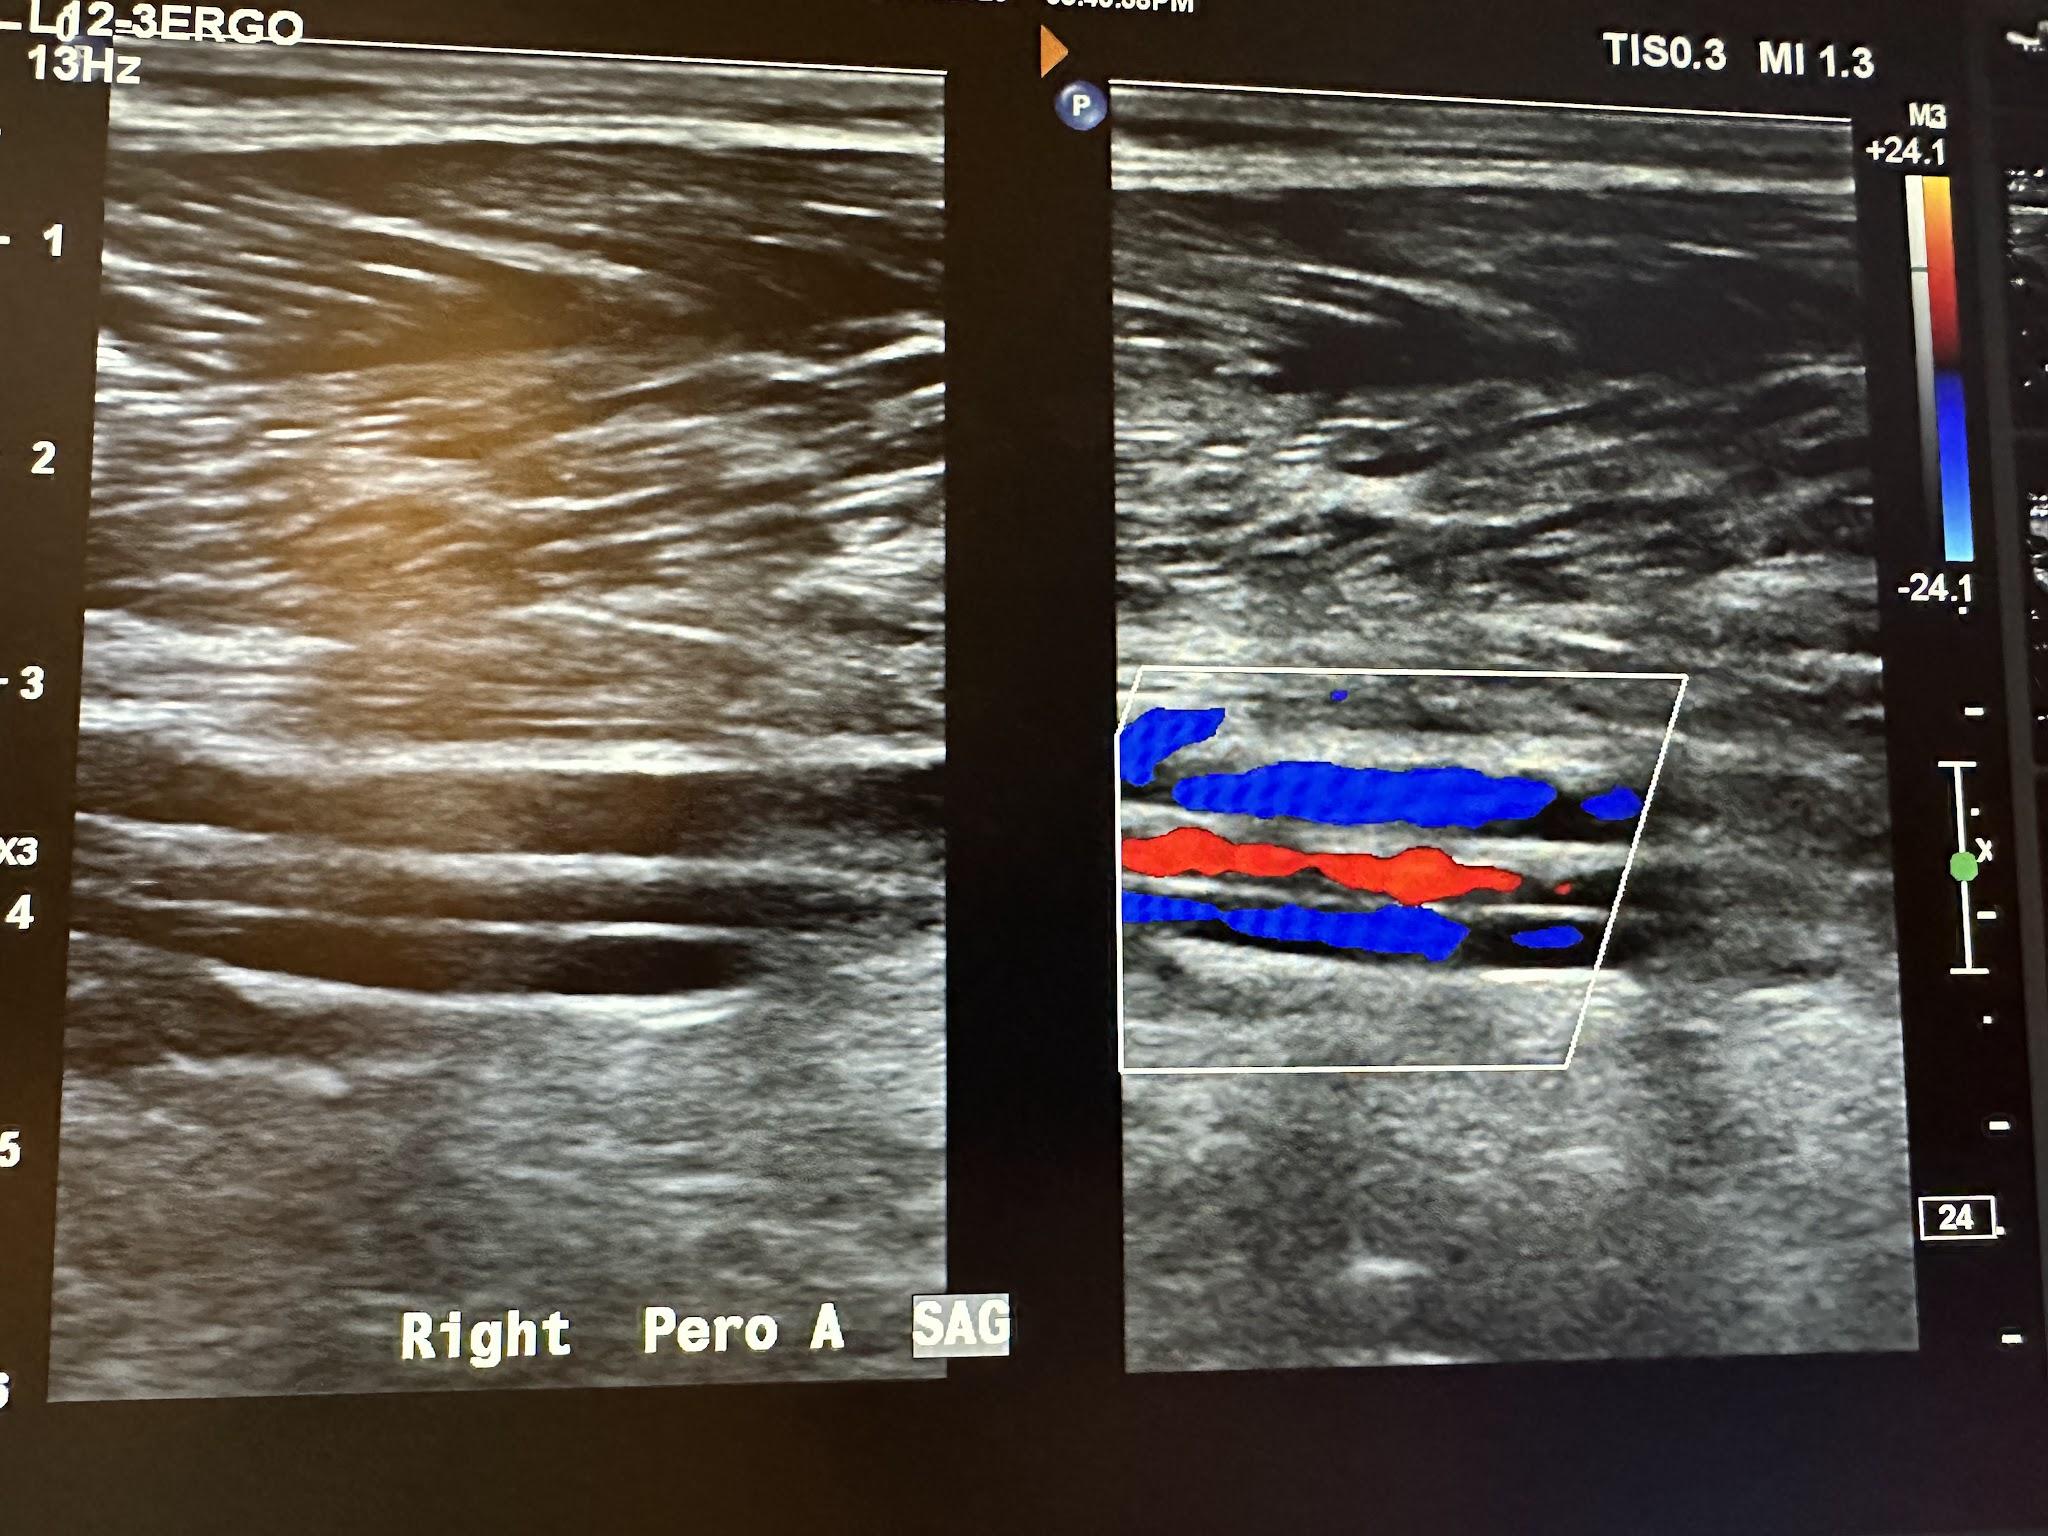
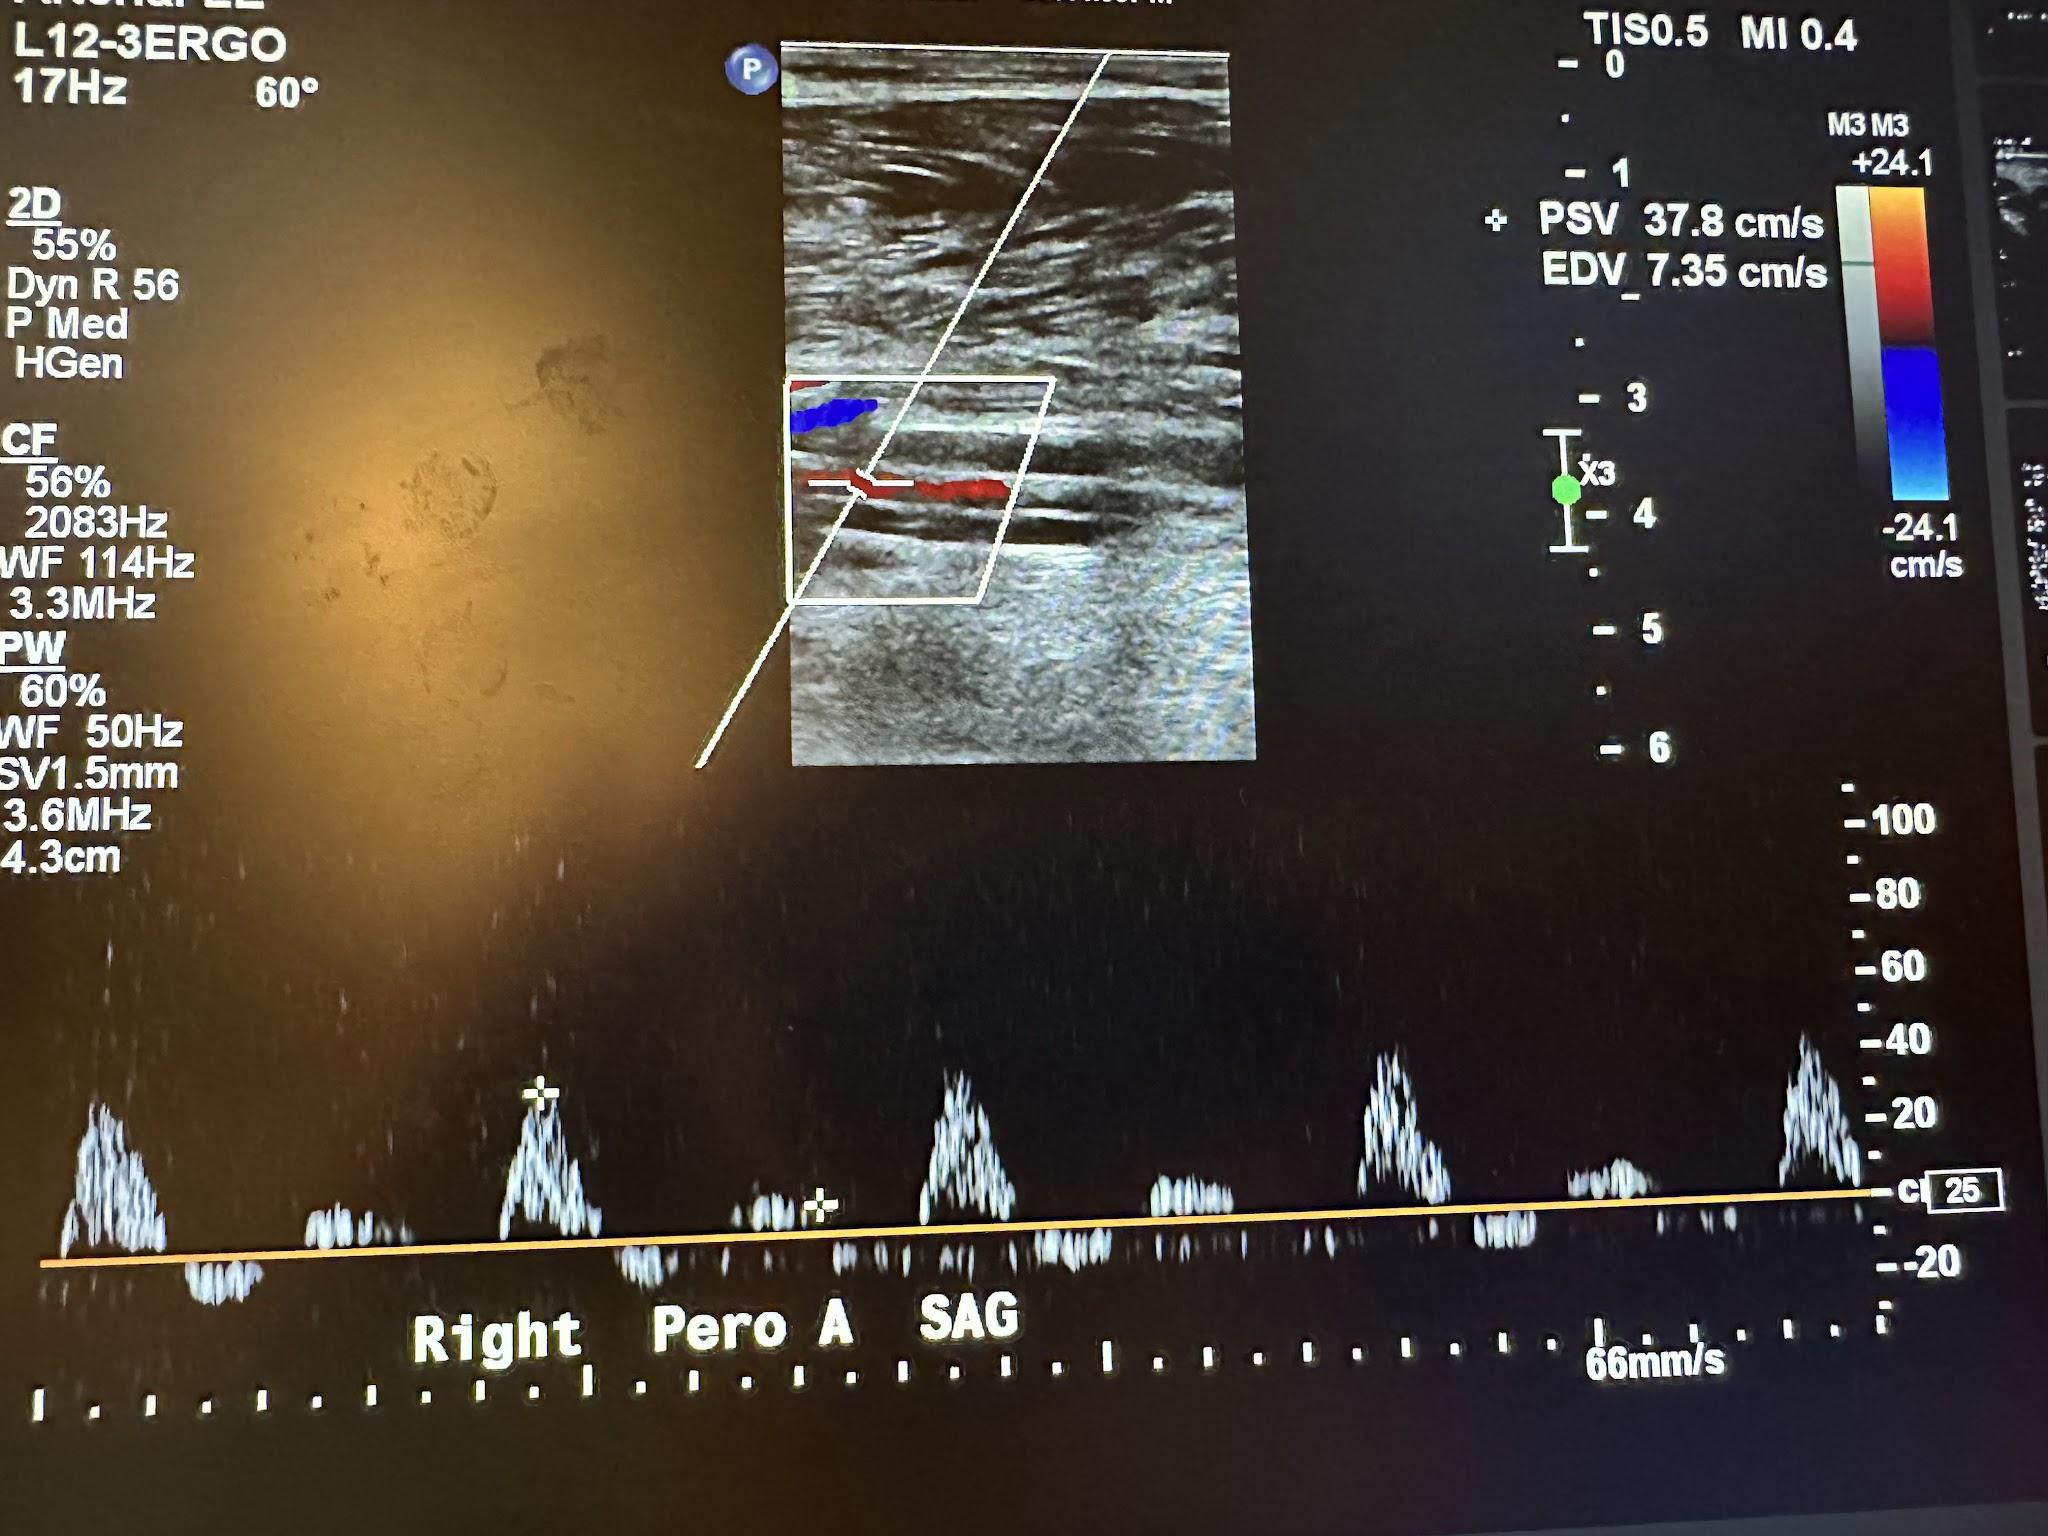
Figure 10-70 shows the side-by-side sagittal view of the right anterior tibial artery without and with color Doppler. Figure 10-71 shows the sagittal view of the right anterior tibial artery with color Doppler and waveform analysis.
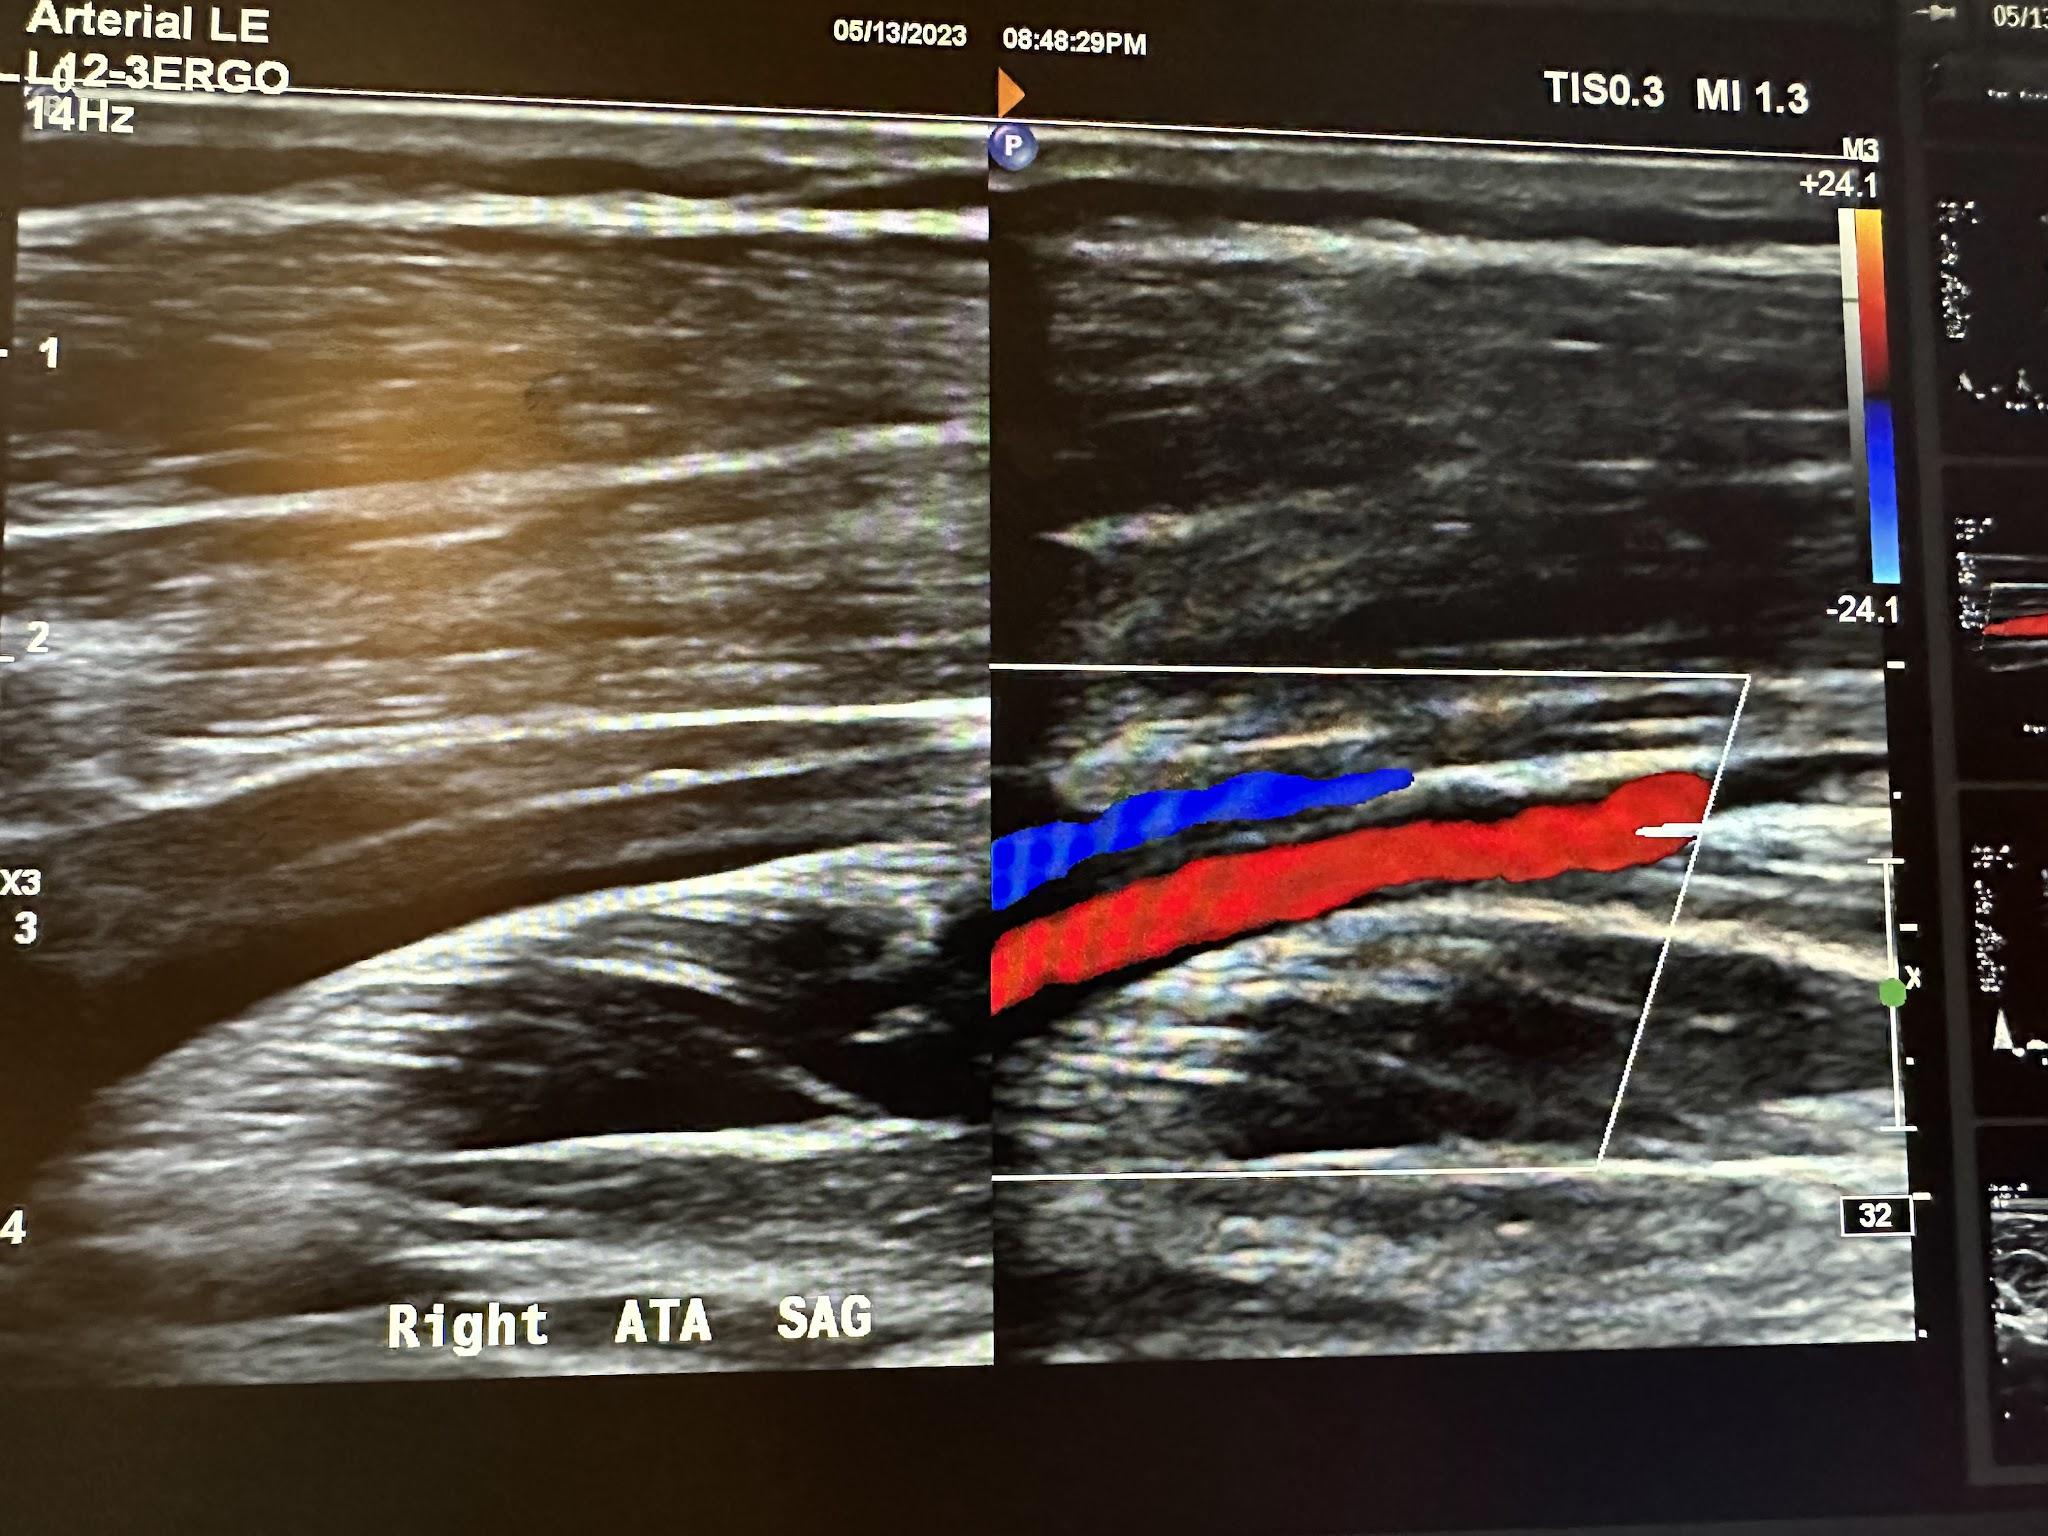
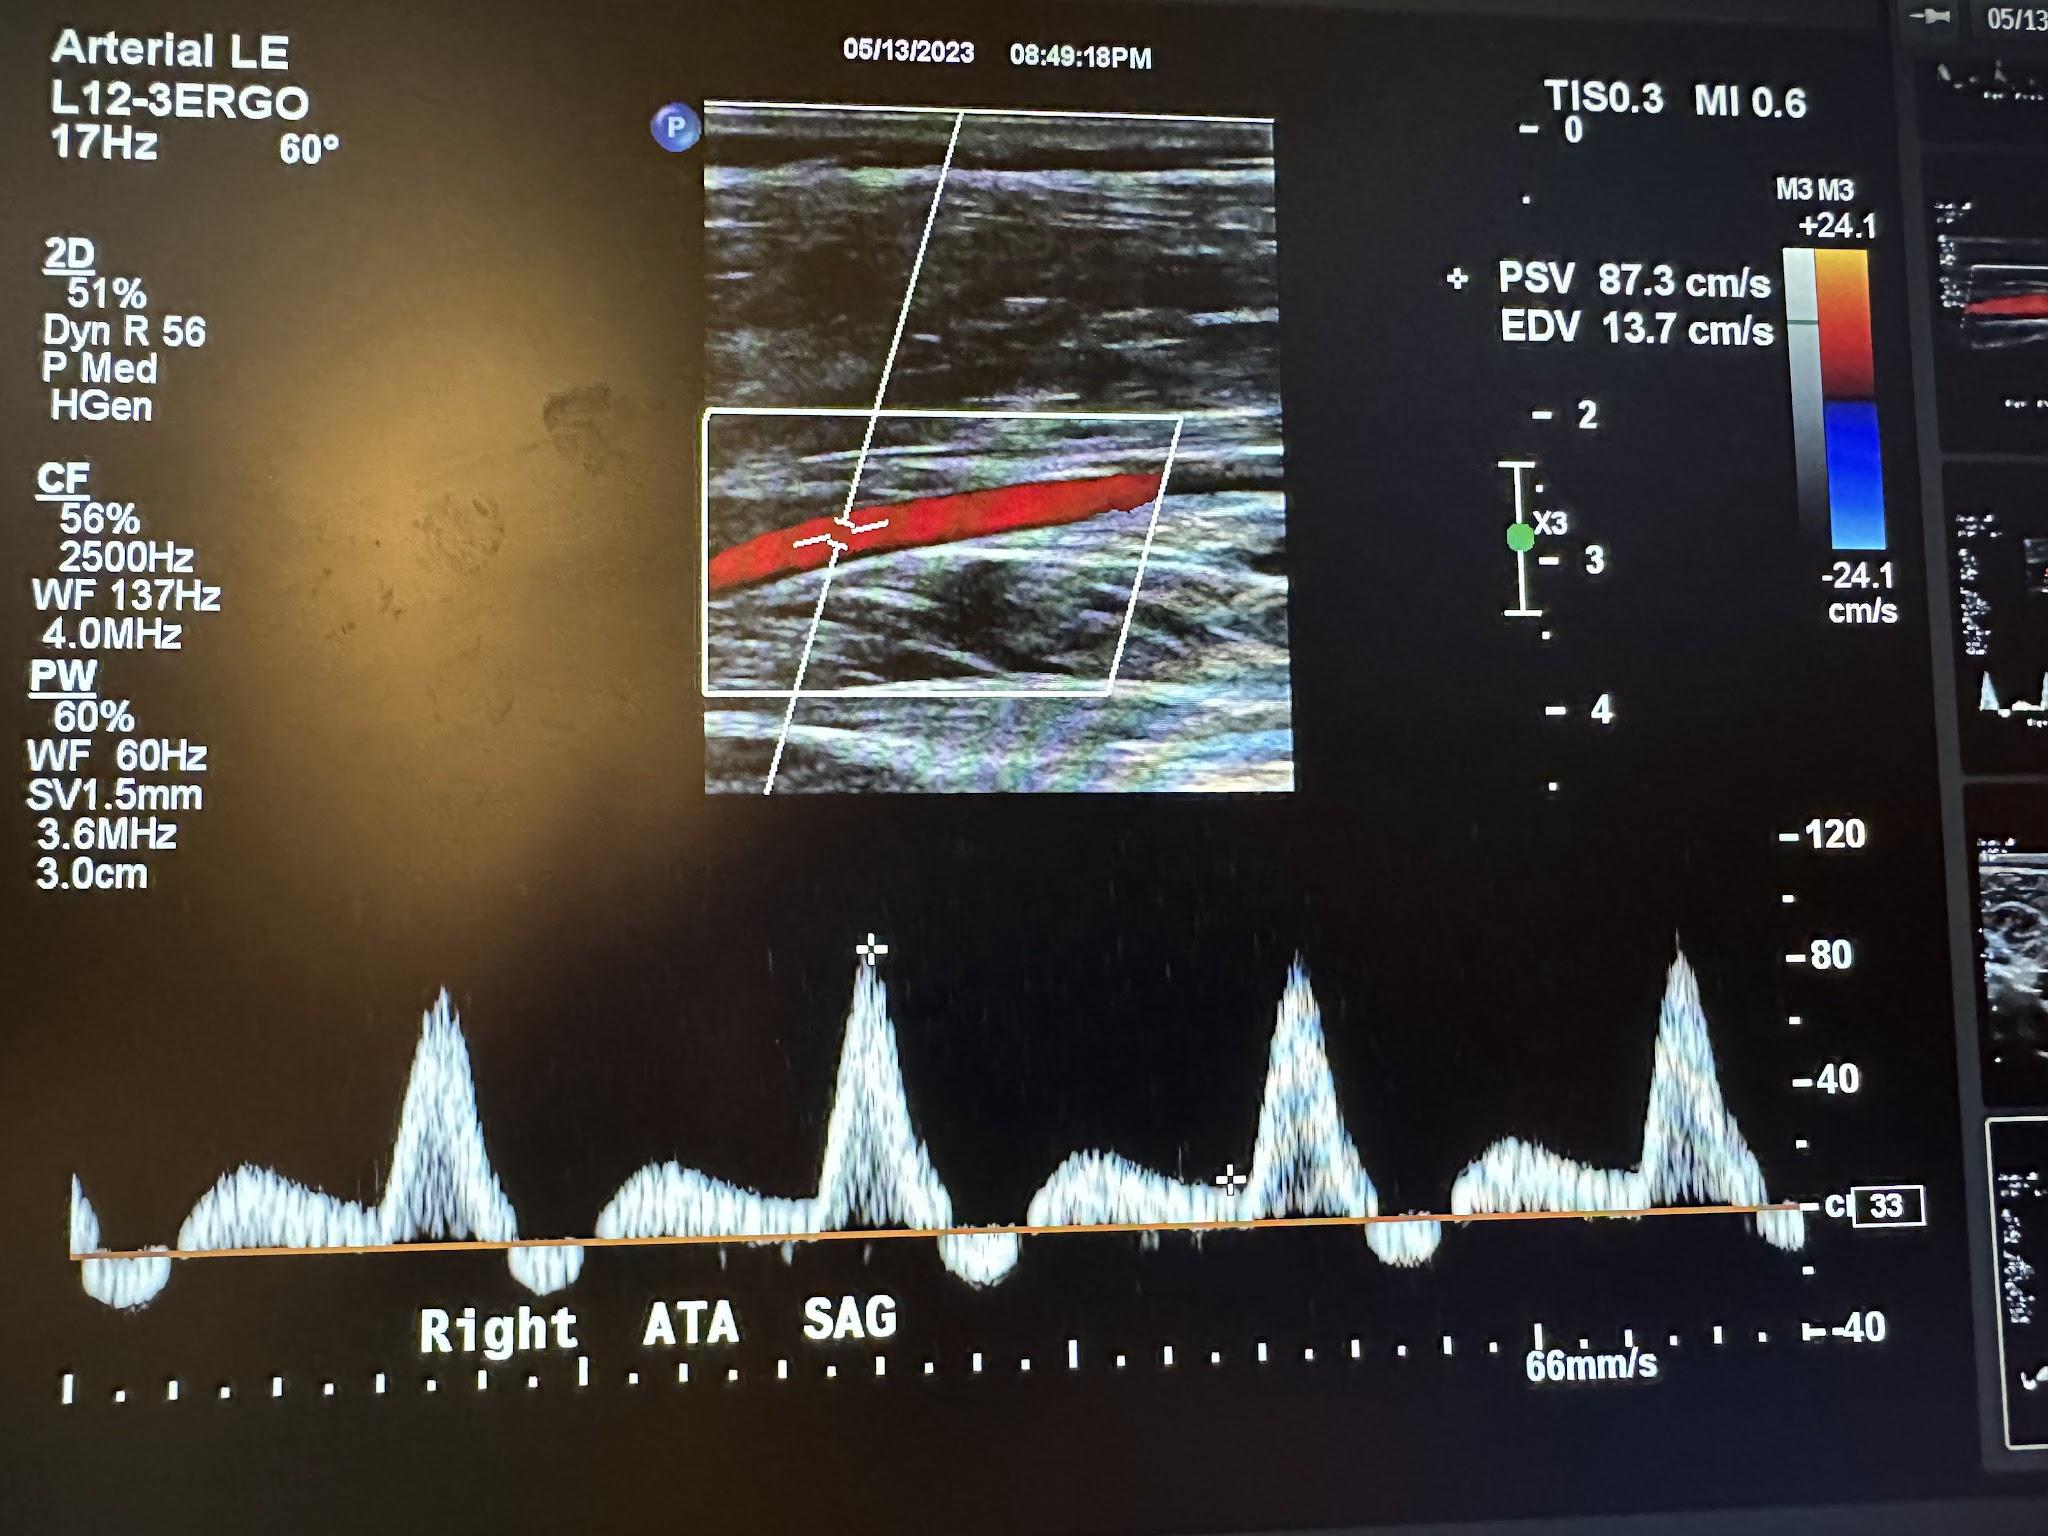
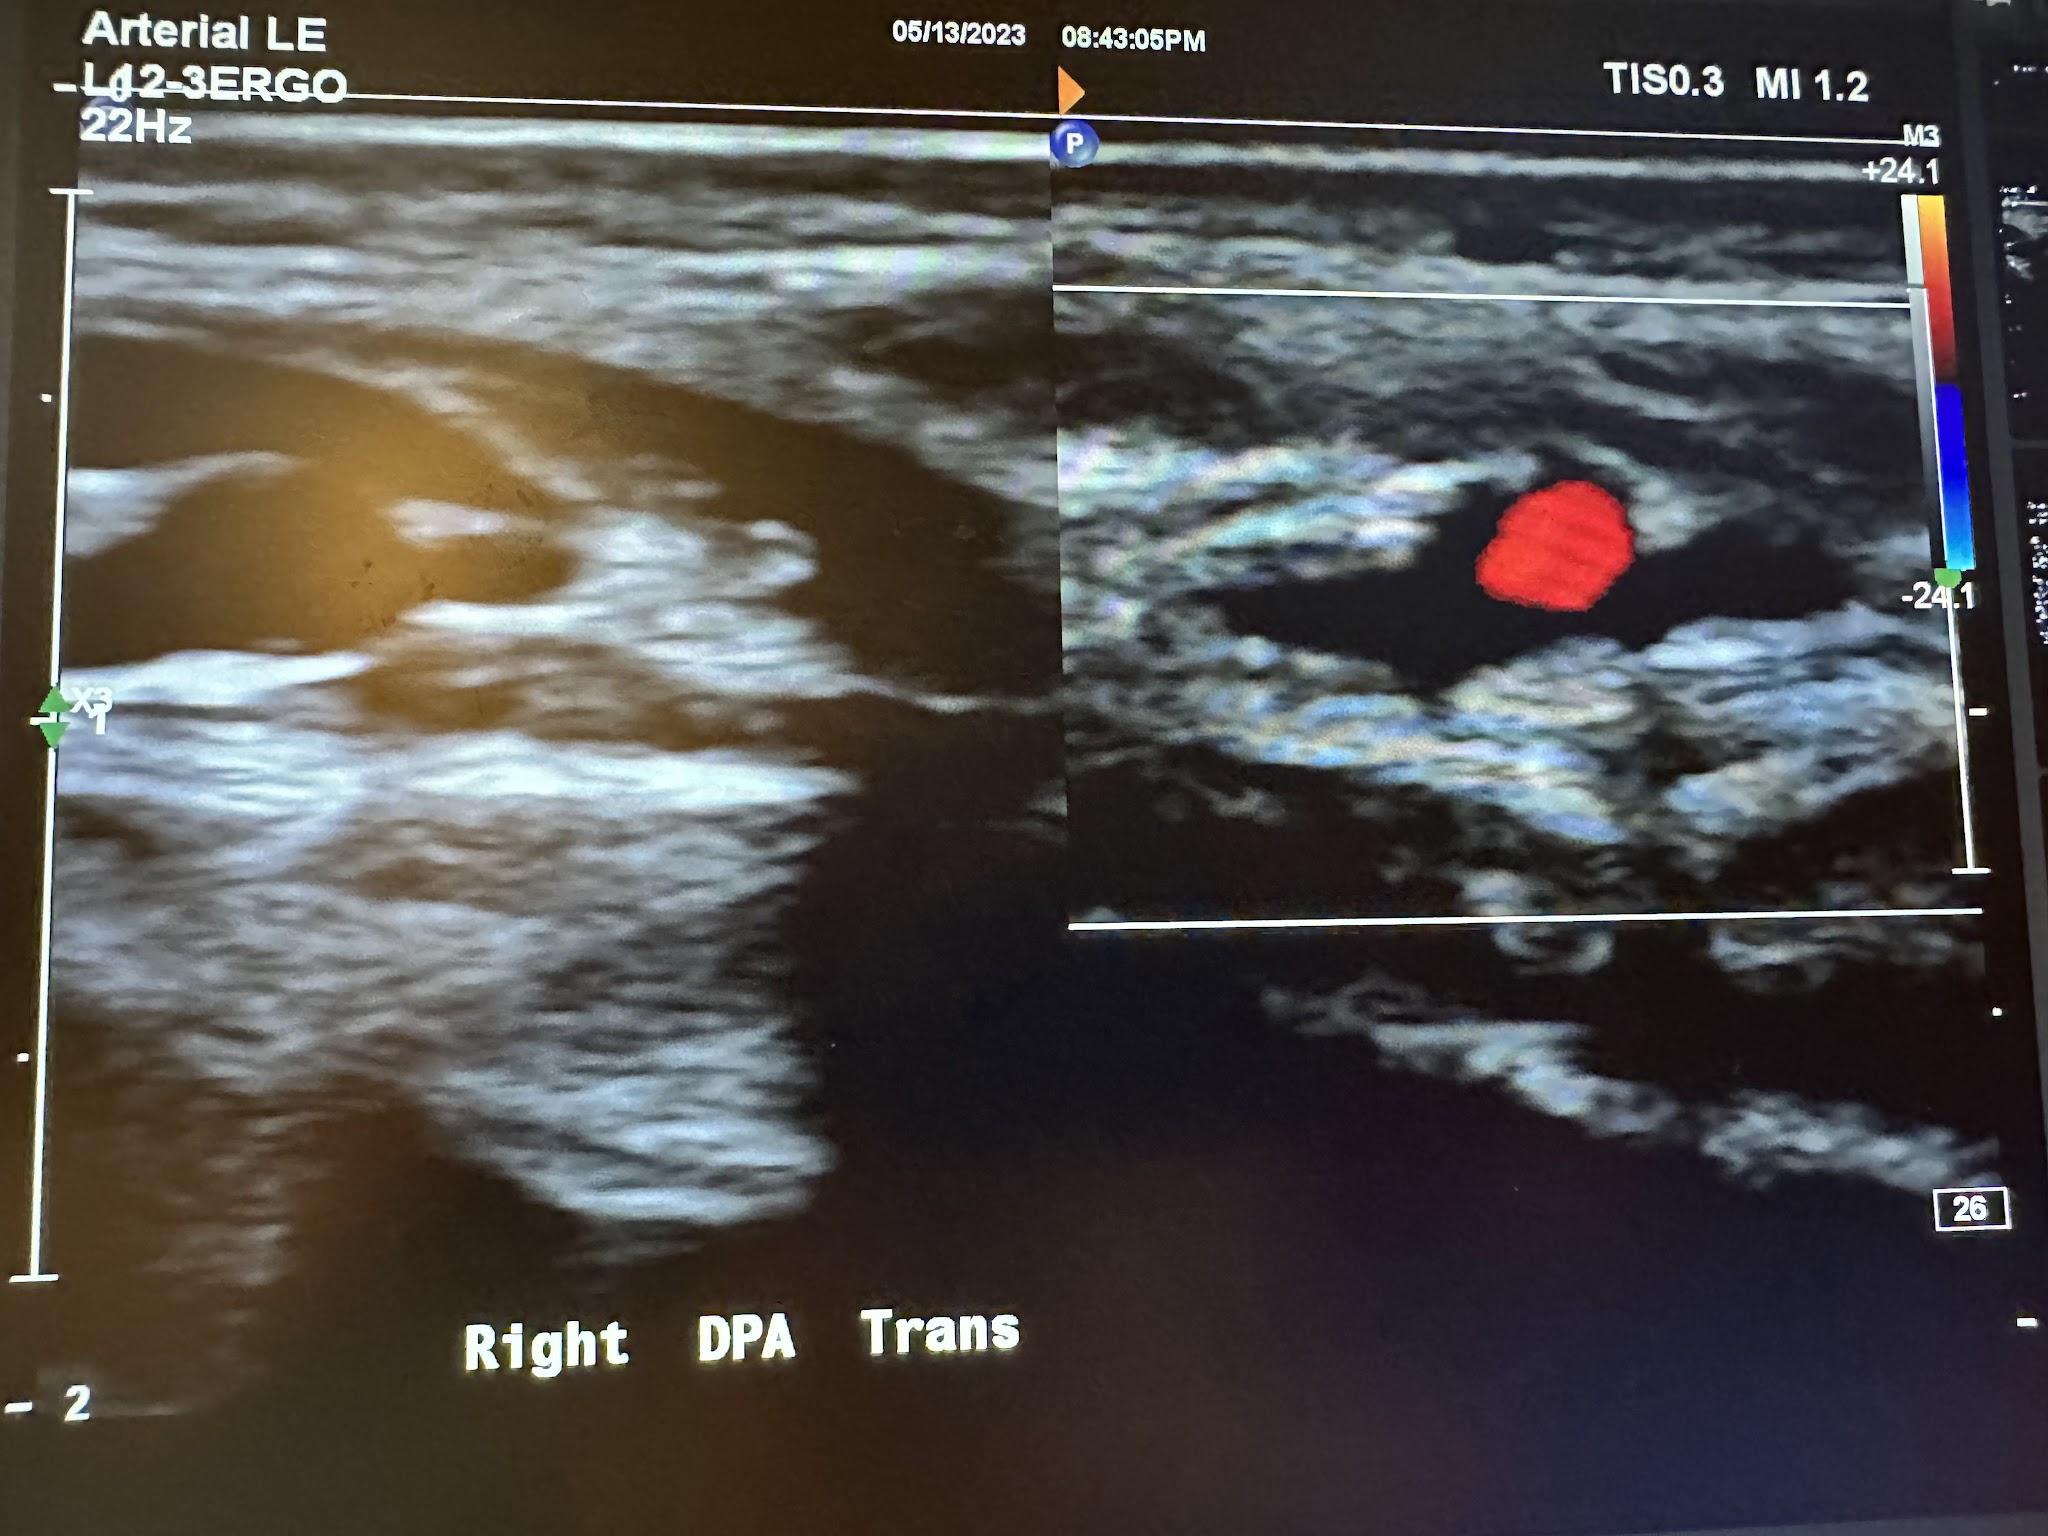
Figure 10-72 shows the transverse view of the right dorsalis pedis artery without and with color Doppler. Figure 10-73 shows the sagittal view of the right dorsalis pedis artery with color Doppler and waveform analysis.
Figure 10-73: Sagittal image of the right dorsalis pedis artery with color Doppler.
When evaluating the lower extremities for diagnostic criteria for PAD, the PSV and velocity ratio (VR) are often used. The VR is defined as the ratio of the PSV of the stenotic area to the PSV of the standard proximal segment. The degree of stenosis is determined by these values of the PSV and VR, as illustrated in Table 10-2.[22]
Table 10–2: Guidelines for determining the degree of stenosis.
|
Degree of stenosis |
Peak systolic velocity (cm/s) |
Velocity ratio |
|
<20% |
<150 |
<1.5 |
|
20–49% |
150–200 |
1.5–2.0 |
|
50–80% |
200–300 |
2.0–4.0 |
|
>80% |
>300 |
>4.0 |
|
Occlusion |
No flow detected in lumen |
N/A |
10.6 Self-Assessment
- What happens to ultrasound imaging of normal veins when you apply downward pressure with the transducer?
- What frequency transducer would you typically use to evaluate the circle of Willis?
- What kind of Doppler is used to evaluate the arterial system of the lower extremities?
10.7 Further Readings
- Pugsley MK, Tabrizchi R. The vascular system. An overview of structure and function. J Pharmacol Toxicol Methods. 2000 Sep–Oct;44(2):333–40. doi: 10.1016/s1056-8719(00)00125-8. PMID: 11325577.
- Rumwell C. McPharlin M. Vascular Technology: An illustrated review. 4th ed. [place unknown]: Davies publishing; 2011. p. 442.
- Katz ML, Alexandrov AV. A Practical Guide to Transcranial Doppler Examinations. [place unknown]: Summer publishing; 2003. p. 158.
- Zemaitis MR, Boll JM, Dreyer MA. Peripheral Arterial Disease. [Updated 2023 May 23]. In: StatPearls [internet]. Treasure Island (FL): StatPearls Publishing; 2023 Jan–. Available from: https://www.ncbi.nlm.nih.gov/books/NBK430745/
- Meissner MH, Moneta G, Burnand K, Gloviczki P, Lohr JM, Lurie F, Mattos MA, McLafferty RB, Mozes G, Rutherford RB, Padberg F, Sumner DS. The hemodynamics and diagnosis of venous disease. J Vasc Surg. 2007 Dec;46 Suppl S:4S–24S. doi: 10.1016/j.jvs.2007.09.043. PMID: 18068561. ↵
- Schellong S, Schwarz T. Peripheral Venous Anatomy and Physiology. In: Lanzer P, Topol EJ, editors. Pan Vascular Medicine. Berlin, Heidelberg: Springer; 2002. p. 1489–1491. Available from: https://doi.org/10.1007/978-3-642-56225-9_92 ↵
- Schellong S, Schwarz T. Peripheral Venous Anatomy and Physiology. In: Lanzer P, Topol EJ, editors. Pan Vascular Medicine. Berlin, Heidelberg: Springer; 2002. p. 1489–1491. Available from: https://doi.org/10.1007/978-3-642-56225-9_92 ↵
- Schellong S, Schwarz T. Peripheral Venous Anatomy and Physiology. In: Lanzer P, Topol EJ, editors. Pan Vascular Medicine. Berlin, Heidelberg: Springer; 2002. p. 1489–1491. Available from: https://doi.org/10.1007/978-3-642-56225-9_92 ↵
- Davis D. Introduction to Transcranial Doppler Ultrasound [DVD]. St Petersburg (FL): Gulfcoast Ultrasound Institute; 2013 Feb 28–Mar 21. ↵
- Katz ML, Alexandrov AV. A Practical Guide to Transcranial Doppler Examinations. [place unknown]: Summer publishing; 2003. p. 158. ↵
- Davis D. Introduction to Transcranial Doppler Ultrasound [DVD]. St Petersburg (FL): Gulfcoast Ultrasound Institute; 2013 Feb 28–Mar 21. ↵
- Katz ML, Alexandrov AV. A Practical Guide to Transcranial Doppler Examinations. [place unknown]: Summer publishing; 2003. p. 158. ↵
- Davis D. Introduction to Transcranial Doppler Ultrasound [DVD]. St Petersburg (FL): Gulfcoast Ultrasound Institute; 2013 Feb 28–Mar 21. ↵
- Katz ML, Alexandrov AV. A Practical Guide to Transcranial Doppler Examinations. [place unknown]: Summer publishing; 2003. p. 158. ↵
- Davis D. Introduction to Transcranial Doppler Ultrasound [DVD]. St Petersburg (FL): Gulfcoast Ultrasound Institute; 2013 Feb 28–Mar 21. ↵
- Katz ML, Alexandrov AV. A Practical Guide to Transcranial Doppler Examinations. [place unknown]: Summer publishing; 2003. p. 158. ↵
- Rumwell C. McPharlin M. Vascular Technology: An illustrated review. 4th ed. [place unknown]: Davies publishing; 2011. p. 442. ↵
- Meissner MH, Moneta G, Burnand K, Gloviczki P, Lohr JM, Lurie F, Mattos MA, McLafferty RB, Mozes G, Rutherford RB, Padberg F, Sumner DS. The hemodynamics and diagnosis of venous disease. J Vasc Surg. 2007 Dec;46 Suppl S:4S–24S. doi: 10.1016/j.jvs.2007.09.043. PMID: 18068561. ↵
- Rumwell C. McPharlin M. Vascular Technology: An illustrated review. 4th ed. [place unknown]: Davies publishing; 2011. p. 442. ↵
- Green L, Jorgensen T, Schroedter B, Bendick P. Carotid Duplex and Color Flow Imaging [DVD]. St Petersburg (FL): Gulfcoast Ultrasound Institute; 2012 Feb 20–22. ↵
- Bandyk D, Armstrong PA, Neumyer MJ. Vascular Ultrasound Interpretation [DVD]. St Petersburg (FL): Gulfcoast Ultrasound Institute; 2012 August 9–10. ↵
- Grant EG, Benson CB, Moneta GL, Alexandrov AV, Baker JD, Bluth EI, Carroll BA, Eliasziw M, Gocke J, Hertzberg BS, Katanick S, Needleman L, Pellerito J, Polak JF, Rholl KS, Wooster DL, Zierler RE. Carotid artery stenosis: Gray-scale and Doppler US diagnosis—Society of Radiologists in Ultrasound Consensus Conference. Radiology. 2003 Nov;229(2):340–6. doi: 10.1148/radiol.2292030516. Epub 2003 Sep 18. PMID: 14500855. ↵
- North American Symptomatic Carotid Endarterectomy Trial. Methods, patient characteristics, and progress. Stroke. 1991 Jun;22(6):711–20. doi: 10.1161/01.str.22.6.711. PMID: 2057968. ↵
- Chaikof EL, Dalman RL, Eskandari MK, Jackson BM, Lee WA, Mansour MA, Mastracci TM, Mell M, Murad MH, Nguyen LL, Oderich GS, Patel MS, Schermerhorn ML, Starnes BW. The Society for Vascular Surgery practice guidelines on the care of patients with an abdominal aortic aneurysm. J Vasc Surg. 2018 Jan;67(1):2–77.e2. doi: 10.1016/j.jvs.2017.10.044. PMID: 29268916. ↵
- Meissner MH, Moneta G, Burnand K, Gloviczki P, Lohr JM, Lurie F, Mattos MA, McLafferty RB, Mozes G, Rutherford RB, Padberg F, Sumner DS. The hemodynamics and diagnosis of venous disease. J Vasc Surg. 2007 Dec;46 Suppl S:4S–24S. doi: 10.1016/j.jvs.2007.09.043. PMID: 18068561. ↵
- Hodgkiss-Harlow KD, Bandyk DF. Interpretation of arterial duplex testing of lower-extremity arteries and interventions. Semin Vasc Surg. 2013 Jun–Sep;26(2–3):95–104. doi: 10.1053/j.semvascsurg.2013.11.002. Epub 2013 Nov 14. PMID: 24636606. ↵

