
1 Basic Principles of Ultrasound
1.1 Learning Objectives
After reviewing this chapter, you should be able to do the following:
- Define ultrasound and describe its characteristics as a form of energy.
- Explain the principles of sound wave propagation, including frequency, wavelength, amplitude, and velocity.
- Describe the piezoelectric effect and how it is used in ultrasound transducers.
- Explain the difference between longitudinal and transverse waves and how they relate to ultrasound.
- Understand the concept of acoustic impedance and its effect on ultrasound imaging.
- Describe the interaction of ultrasound with tissue, including absorption, reflection, and scattering.
1.2 Introduction
This chapter introduces the fundamental principles of sound wave propagation, including frequency, wavelength, amplitude, and velocity and how these relate to ultrasound imaging. The chapter also covers the interaction of ultrasound with tissue, including absorption, reflection, and scattering.
1.3 Why Study Ultrasound?
Ultrasound has a wide range of medical applications. These include its use in obstetrics (monitoring the progress of pregnancy), oncology (monitoring the growth of tumors), cardiology (visualizing heart function and physiology), and biopsy (guiding needles in various procedures) and as a rehabilitation modality. For example, today, an estimated 60–70% of pregnant women in the United States undergo ultrasound examinations during pregnancy. An estimated 250 million fetal ultrasound examinations are performed annually in the United States.[1] The examination aims to assess fetal abnormalities, confirm the site of pregnancy within the uterus, and determine gestational age.
Due to the increasing use of ultrasound in health care, most medical schools are transforming curricula to include medical ultrasound applications. In addition, most medical professions require successful completion of a Sonography Principles and Instrumentation (SPI) examination and some specialty examinations administered by the American Registry for Diagnostic Medical Sonography (ARDMS). The SPI examination requires a sound knowledge of the physical principles of ultrasound and imaging, which includes an understanding of the physics of ultrasound and imaging techniques. This requirement is appalling to most clinicians with no physics background. On the other hand, depending on the individual’s interest, a specialty examination will be given in one or more of the following areas: abdomen, breast, echocardiography, obstetrics, gynecology, pediatric, vascular technology, or musculoskeletal ultrasound. Most hospitals recognize ARDMS credentials as requirements for clinical sonographers and physicians.
Ultrasound images in medical imaging are generated from sound waves reflected from different tissues and organs and converted into electrical signals, which a computer processes to create an image displayed on a screen. This technology helps health care professionals visualize internal structures and diagnose medical conditions. To make it easier to understand the operation of a medical ultrasound machine, we will first discuss some basic physics principles.
1.4 Mechanical Vibrations and Waves
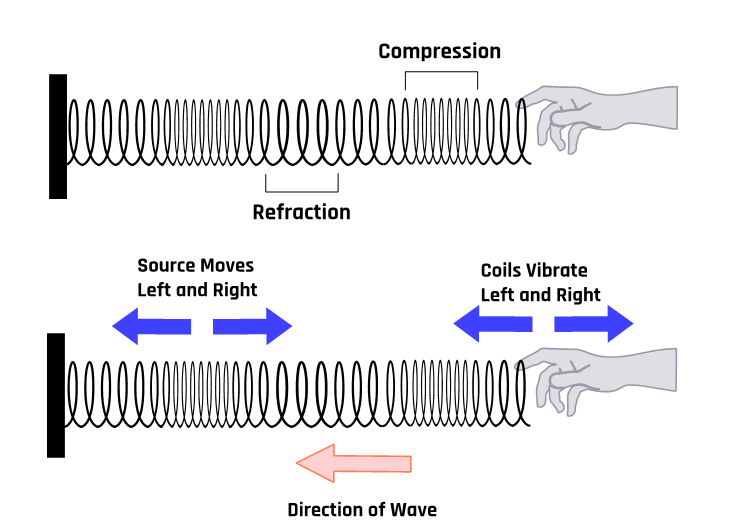
A mechanical vibration is a back-and-forth motion. When vibrations affect the media around them, waves are generated. These waves transport energy from one point to another. If a single vibratory disturbance moves from one point to the other, it is called a pulse. A back-and-forth motion that occurs repeatedly is called a periodic motion.
A mechanical wave requires a material medium (such as a solid, liquid, or gas) to propagate through; its speed depends on the properties of that medium. Mechanical waves fall into two classes: longitudinal and transverse waves. For a transverse wave, the displacement of the medium is perpendicular to the direction of the motion of the wave. In a longitudinal wave, the displacement of the medium is in the same direction as wave motion. One example of a longitudinal wave is sound. These waves are similar to the motion of a pulse on a slinky, as illustrated in Figure 1-1.
1.5 Characteristics of Sound Waves
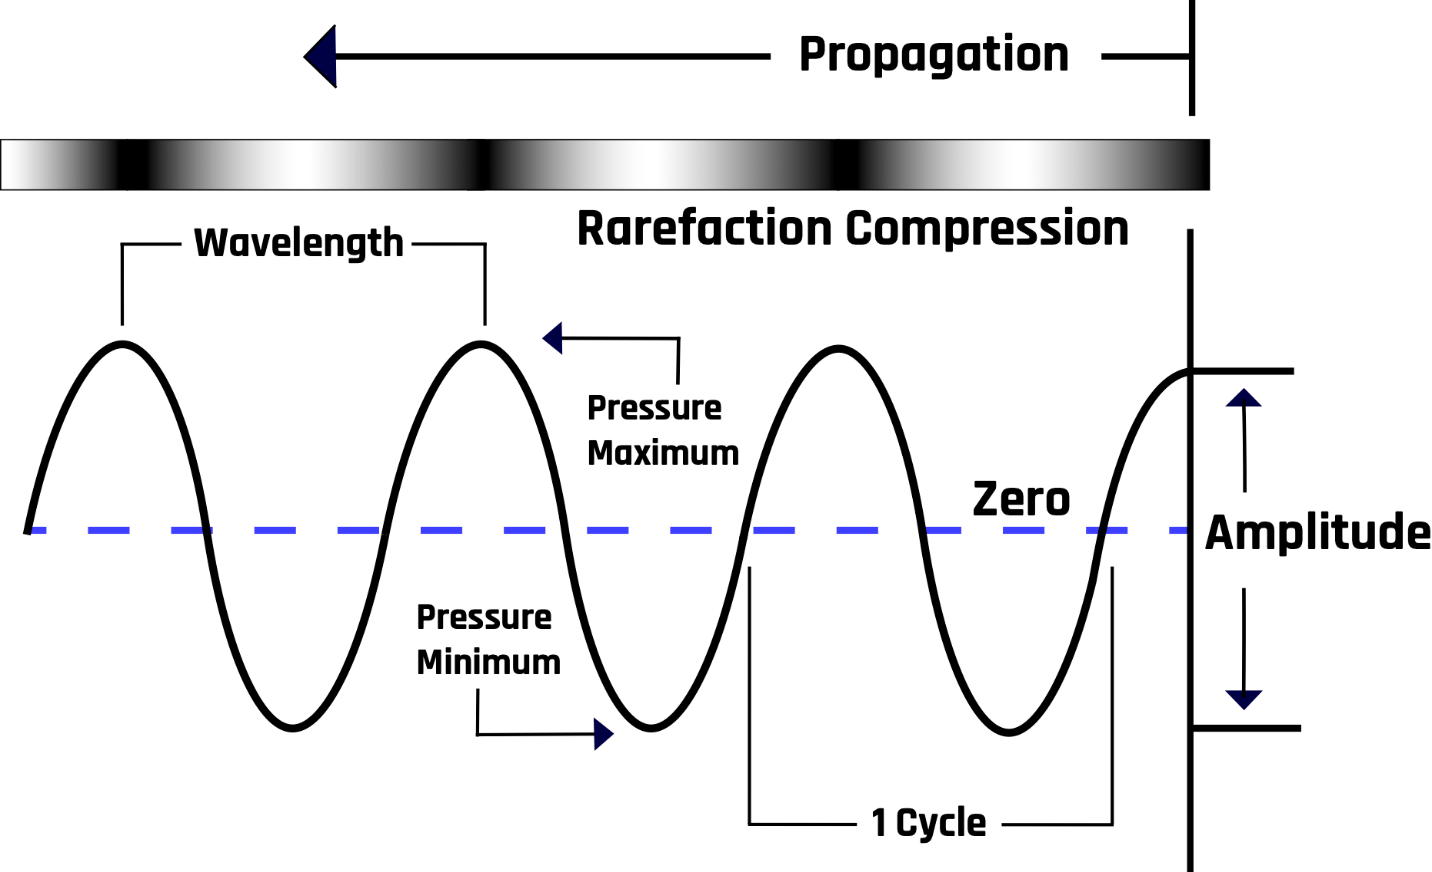
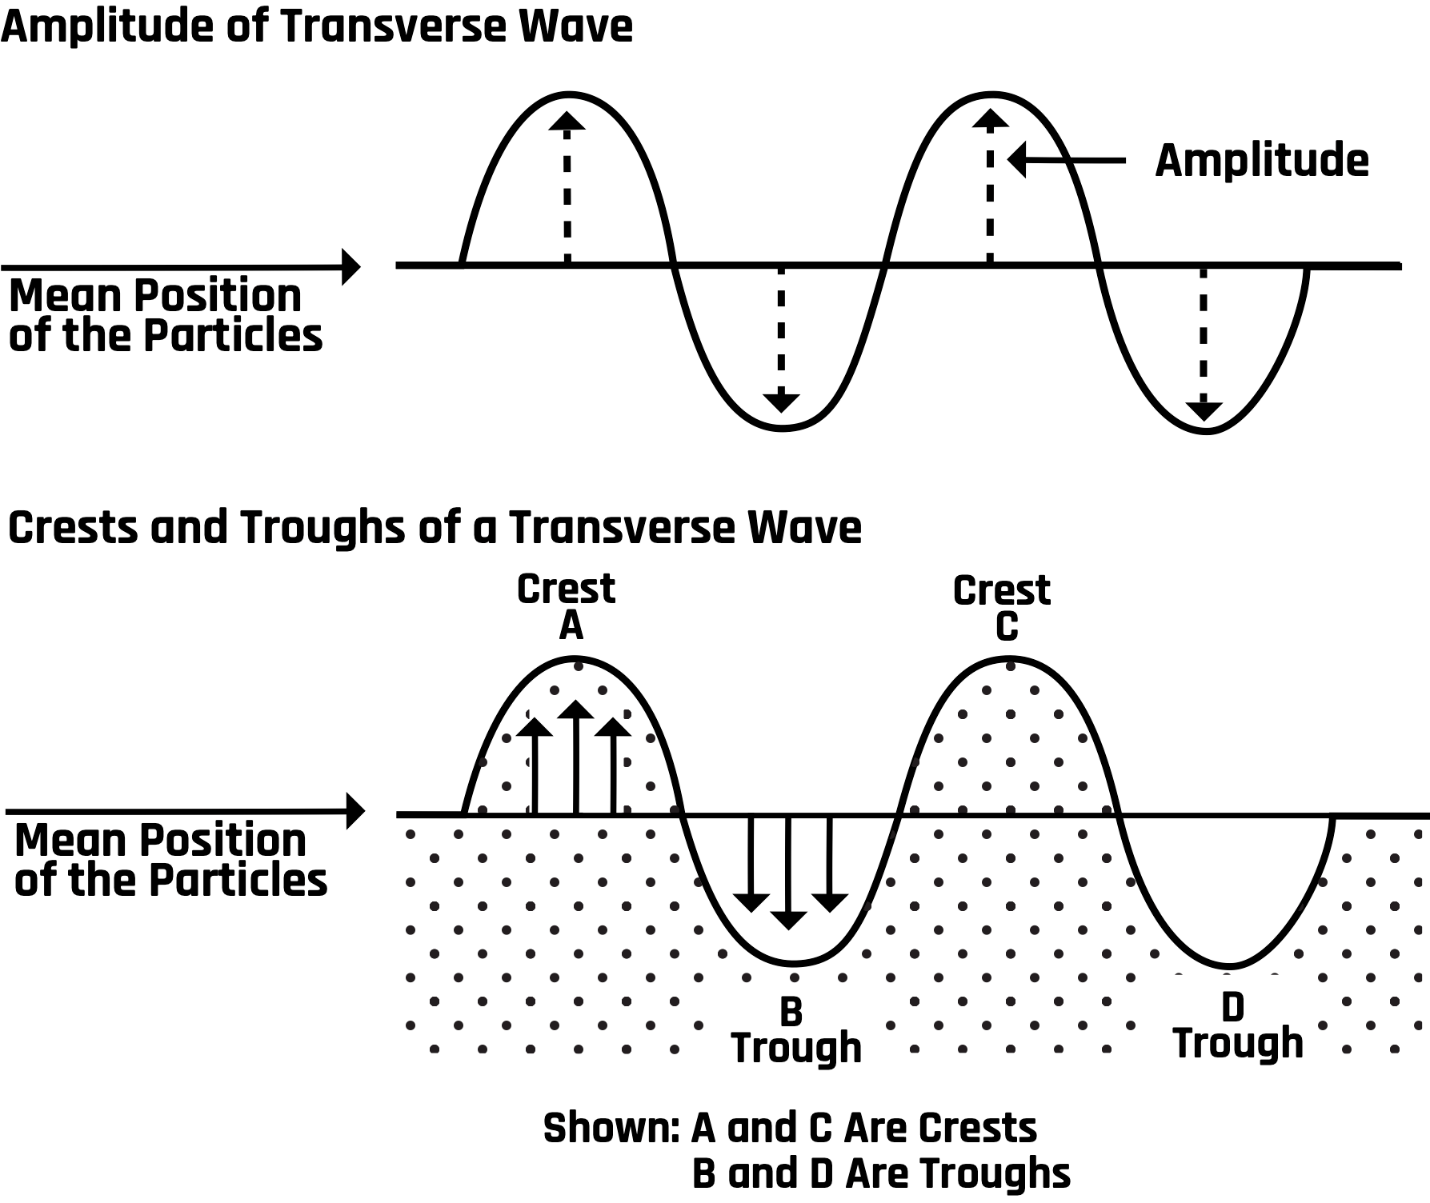
A sound wave comprises alternating regions of low and high pressures. The waveform is a sinusoidal wave function in which the crests and troughs represent high- and low-pressure regions, respectively, as shown in Figure 1-2.
1.5.1 Amplitude and Wavelength
The maximum displacement or height from the horizontal axis, the equilibrium position, is the amplitude (A) of the wave. The distance between two successive points in the same phase is the wavelength (λ). For example, the wavelength is the distance between neighboring peaks, neighboring troughs, or any two points where the wave returns to the same shape, as shown in Figure 1-3.
1.5.2 Period and Frequency
The time for one complete cycle is the period (T); it is related to the number of oscillations (complete cycles) per unit time, called the frequency (f), as follows: T = 1/f. The unit of frequency is the cycle/second = 1/s or s-1. One cycle per second = 1 hertz (Hz).
1.5.3 Wave Velocity
The rate at which the waveform changes position with respect to time is called the velocity (v) of the wave. In mathematical form, v = f λ. The wave velocity depends on the characteristics of the medium in which it travels. The velocity has a unit of meters per second if the frequency (f) is in hertz and the wavelength (λ) is in meters. The speed of sound is fastest in solids, slower in liquids, and slowest in air. Sound does not travel through free space or vacuums due to the lack of a medium.
1.6 Audible and Ultrasound Waves
Sound waves are classified into three categories based on their frequency: infrasonic, audible, and ultrasonic waves.
Infrasonic waves: These are waves with frequencies of less than 20 Hz; they are not audible to the human ear. Various natural and man-made sources produce them, including earthquakes, volcanoes, thunderstorms, and industrial machinery. Animals such as elephants, whales, and alligators also produce these waves to communicate over long distances.
Audible waves: These are sound waves with frequencies that the human ear can hear. The audible frequencies fall in the range of about 20 Hz to 20 kHz. The audible range of sound can vary between individuals due to various factors. Age is one factor that can affect a person’s ability to hear some frequencies, as the ear’s sensitivity decreases with age. For example, younger people are likely to hear sounds of up to 20 kHz, while older people mostly hear frequencies of far less than 20 kHz. Certain diseases and medical conditions, such as otitis media, otosclerosis, or Meniere’s disease, can also affect a person’s hearing ability. Additionally, individuals with hearing impairments or disabilities may have a reduced hearing range due to damage to the ear or nerve pathways involved in hearing.
Ultrasonic waves (also called ultrasound): These are waves with a frequency of more than 20 kHz. Humans cannot hear ultrasound, but bats use these waves for navigation. However, medical professionals use these waves to examine or image the different parts of the human body, a practice also known as sonography. Medical ultrasound imaging typically uses the 3.5 to 20 MHz frequency range.
1.7 Quantifying Ultrasound
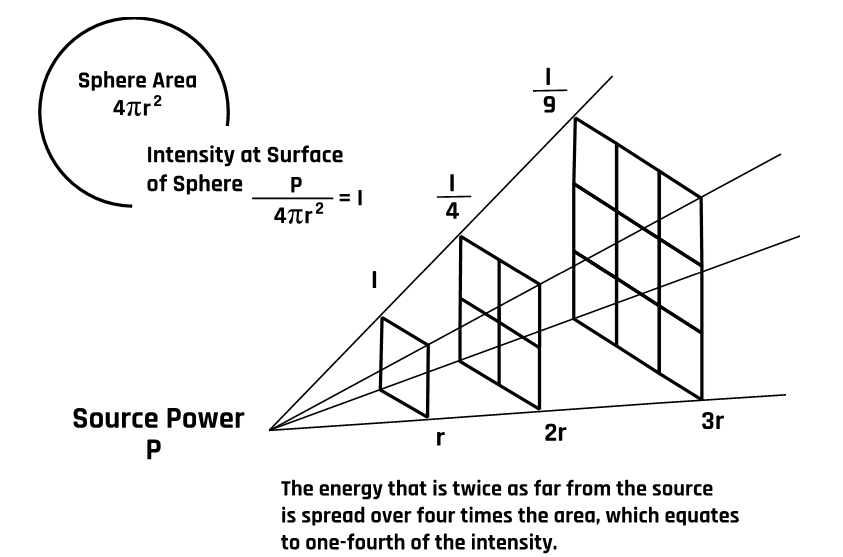
The amount of sound energy flux per unit of time is called the sound intensity (I). For a point source generating sound with acoustic power (P), the intensity (I) at distance (r) from the source obeys the inverse square law:
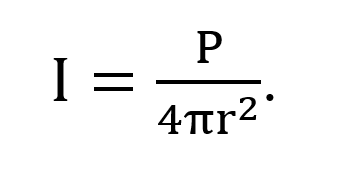
The acoustic power of an ultrasound wave is the quantity of energy generated per unit of time. The standard unit of acoustic power is the watt (W), and 1 watt = 1 joule per second. Therefore, the unit of sound intensity is W/m2. The intensity equation shows that sound intensity decreases as the square of the distance from the point source. We all know that sound loudness (ear perception of sound intensity level) decreases as we move away from the source, as illustrated in Figure 1-4.
The sound intensity level (also called the sound acoustic level) is commonly measured relative to the standard threshold of hearing intensity (Io) in decibels. A decibel is a dimensionless quantity (no units) represented as dB, which is based on the logarithmic scale. In mathematical form, the sound intensity level (ß) is expressed as
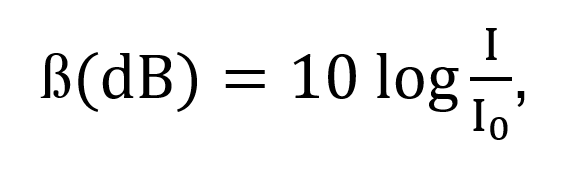
where Io = 10-12 W/m2, which is the faintest audible sound intensity.
1.8 Propagation of Ultrasound Through Tissues
Clinicians examine body tissue structures using ultrasound waves with 2 to 20 MHz frequencies. Inside the tissue structures, the waves propagate through the medium by vibrating molecules of the medium. In soft tissues, the propagation velocity is relatively constant at 1540 m/s. This velocity value is used by ultrasound machines for all human tissue. Ultrasound waves propagating through tissue undergo reflection, refraction, attenuation, scattering, and diffraction.
1.8.1 Reflection
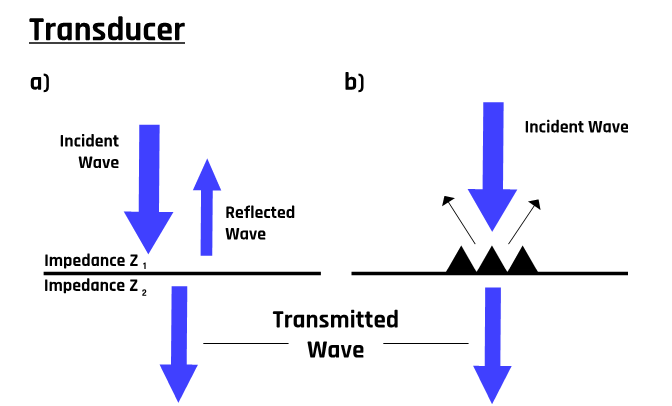
Like any wave, ultrasound waves are reflected at tissue boundaries and interfaces. The transducer detects these reflected waves, and piezoelectric signals are generated and processed into an image form via a computerized processing unit. These signals form the basis of all ultrasound imaging. The number of reflected waves detected by the transducer depends on the angle of incidence at the band boundary and the difference in acoustic impedance between the two tissues traversed by the beam. More details about the acoustic impedance will be discussed later. However, it represents the resistance of a tissue to the passage of ultrasound. Typically, a propagating ultrasound wave is split into two components, as Figure 1-5 illustrates.
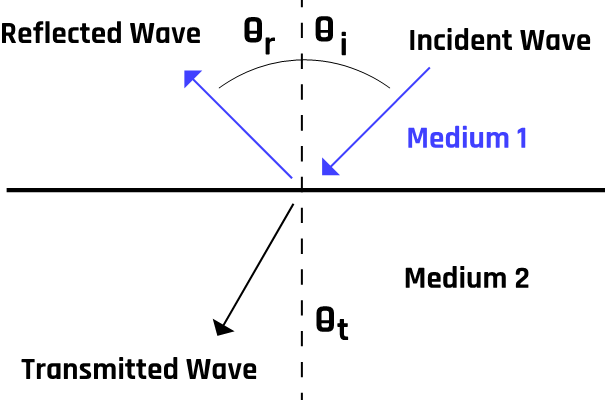
If the wave traverses from medium 1 (with acoustic impedance Z1) to medium 2 (with acoustic impedance Z2), the reflection coefficient is
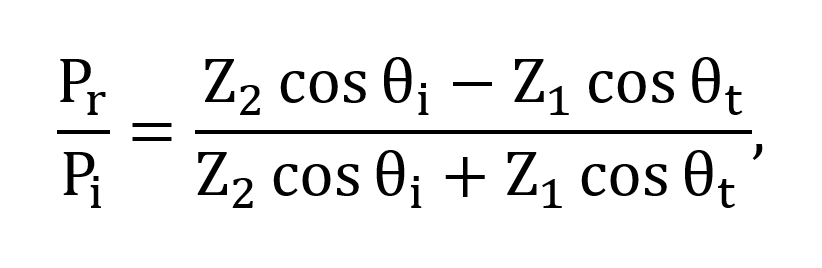
where θi is the angle of incidence, θr is the reflected angle, and θt is the angle of transmission. Pr and Pi represent the reflection and incident probability amplitudes, respectively.
Reflections can also be classified into two categories: specular and diffuse, as illustrated in Figure 1-6.

The ultrasound beam that succeeds in penetrating the boundary layers or interface is called the transmitted wave. The transmission coefficient is mathematically expressed in the following form (refer to Figures 1-5 and 1-7):[2]
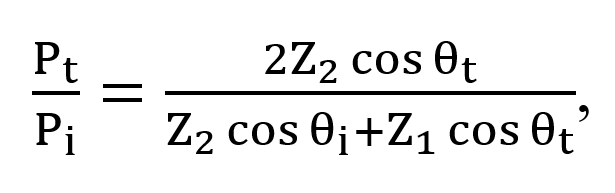
where Pt represents the transmission probability amplitude.
The ratio of the speed of the transmitted wave (v2) to that of the incident wave (v1) is related to the ratio of the sines of the angles of transmission and incidence, a relationship called Snell’s law:
When the waves are reflected from a perfectly flat surface or boundary, the reflected waves tend to be uniformly parallel to each other. In contrast, they tend to be diffuse for rough surfaces. This phenomenon is commonly observed as a “mirage” when driving on a hot summer day, and the road appears to have a wet surface that disappears as one gets closer. This leads to two different kinds of reflections, specular and diffuse, which are illustrated in Figure 1-6.
The transducer picks up the reflected waves and converts the echoes into images. The strength of the echoes depends on the acoustic impedance between the two tissues through which the waves pass. Typically, boundary reflections occur on blood vessel walls and organ boundaries.
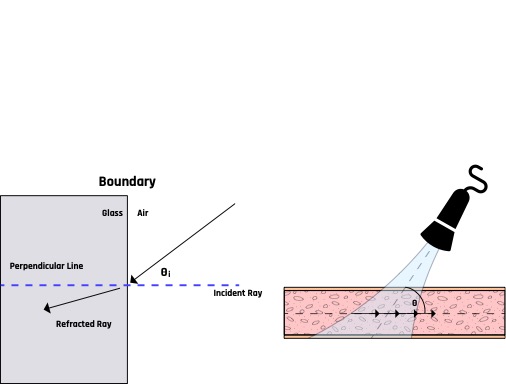
1.8.2 Refraction
When an ultrasound beam strikes a tissue boundary obliquely, the transmitted component of the beam undergoes a change in direction. This change is due to the differences in the velocities of the incident and transmitted beams. This bending process, called refraction, is illustrated in Figure 1-8 and is often related to the formation of artifacts during ultrasound image acquisition.
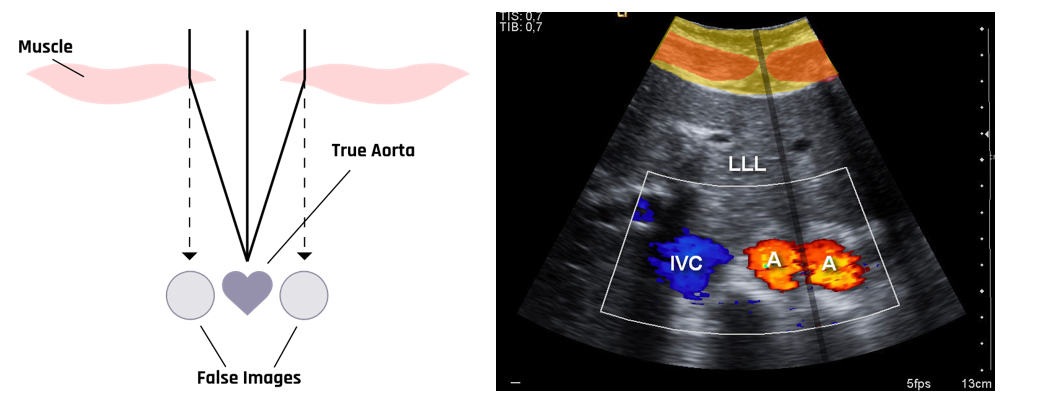
In ultrasound imaging, refraction can result in the formation of artifacts such as double image artifacts, as shown in Figure 1-9. This artifact is caused by the differential refraction of the ultrasound beam while passing through the relatively different echogenic tissues, such as muscle and fat tissues, and the difference in velocities in those tissues.
1.8.3 Scattering
Inside the human body, scattering is mostly a result of small changes in the density, compressibility, and absorption properties of the tissues. Ultrasound scanners detect these scattered waves to show the backscattered signal in the form of images. Scattered waves are primarily caused by red blood cells, or erythrocytes, due to their relatively small diameter of 6–8 µm, compared to the commonly used ultrasound wavelength of about 0.8 mm. For ultrasound frequencies below 20 MHz, the backscattering signal from blood is about 10 to 27 dB lower than from the surrounding tissue.[3] This difference makes it possible to image the blood flow inside the tissue.
1.8.4 Absorption
As the ultrasound beam traverses the tissue structures, it also loses energy through absorption. The lost energy varies depending on the tissue’s characteristics and the ultrasound wave’s frequency. For example, bones absorb more ultrasound energy than soft tissue does. Absorption of ultrasound in tissue is frequency dependent—it increases with increasing frequency.
1.8.5 Attenuation
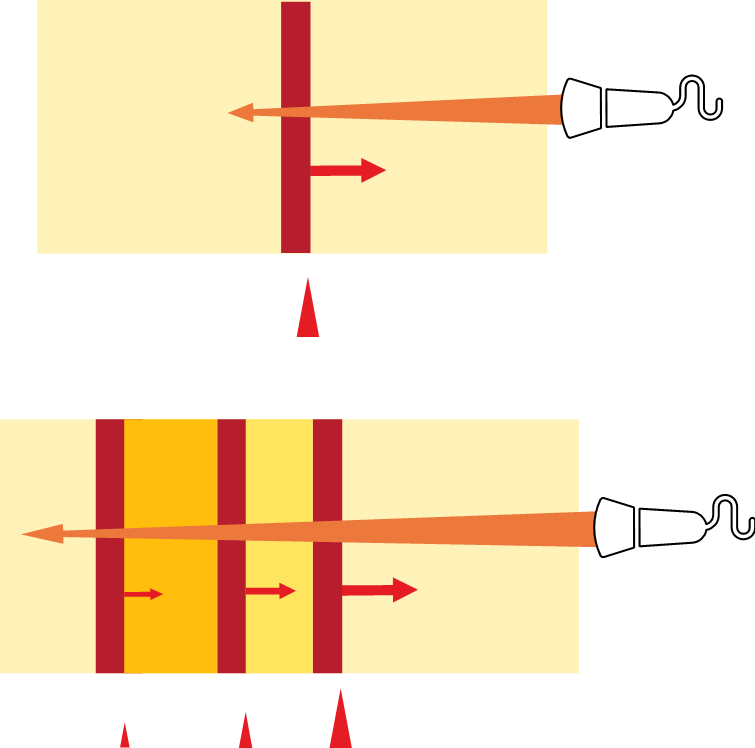
As the ultrasound moves through tissues, some of the ultrasound energy is lost due to absorption through heat, reflection, refraction, and scattering. The beam weakens with increased depth into the tissue, increasing acoustic impedance mismatch. Another factor is the presence of air bubbles inside the tissue, which tend to form virtually impenetrable barriers to ultrasound. Attenuation becomes higher not only with increasing distance from the transducer but also because of the heterogeneity caused by acoustic impedance mismatch as well as the higher frequency of the transducer, as illustrated in Figure 1-10. This is because air has a higher resistance to ultrasound propagation than fluids.
The intensity (Ix) of an ultrasound beam at tissue depth x can be estimated using Beer’s law:
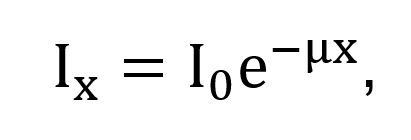
where Io is the incident intensity at the tissue surface and μ is the intensity attenuation coefficient. Of this attenuation, absorption contributes about 60–80%.[4]
Attenuation increases with increasing gas and fat. The higher the tissue density (or impedance), the lower the reflection. For example, blood has an attenuation coefficient value closer to 0.20 dB/MHz.cm, while the typical value for bone is around 20.0 dB/MHz.cm.2
Attenuation generally increases linearly with increasing frequency among different body tissues. Fluid-filled structures have much lower attenuation than solid structures. Hence the transmitted pulse from a fluid-filled structure is usually more substantial than that from passing through an equivalent amount of solid tissue.
1.8.6 Diffraction
The ultrasound beam spreads out with distance from the transducer as it passes through the tissue, causing diffraction, as shown in Figure 1-11. This results in the reduction of beam intensity.
This diffraction pattern is highly dependent on the shape and size of the transducer relative to the wavelength of ultrasound. This phenomenon causes a decrease in the intensity of the ultrasound beam. To achieve a parallel beam, the diameter of the crystal face is designed to be approximately 10 to 20 times the wavelength of ultrasound.

1.8.7 Acoustic Impedance
Acoustic impedance (Z) is the resistance of a tissue to the passage of ultrasound. It depends on the density of the tissue (ρ) and the velocity of propagation (v) of the ultrasound through the tissue: Z = ρv. If the density is in kg/m3 and the velocity is in m/s, then the specific acoustic impedance is expressed in the unit of rayl (Ry), which is equivalent to 1 kg/(m2s). A typical value of acoustic impedance is 0.0004 rayls for air, 1.65 rayls for the liver and blood, and around 5 rayls for the bone.[5]
The greater the difference between two tissues (media), the more the ultrasound is reflected and the lesser the transmission through the tissue. For example, more ultrasound beams will be reflected at soft tissue / bone and soft tissue / air interfaces than at soft tissue / blood interfaces. The difference in acoustic impedance is called acoustic impedance mismatch. A greater acoustic mismatch results in a greater reflection and a lower transmission.[6]
1.9 Self-Assessment
- What are the three different classifications of sound waves?
- To which frequencies do each classification of sound waves correspond?
- What different processes can ultrasound waves undergo as they pass through the body and tissues?
- How is acoustic impedance defined?
1.10 Further Readings
- Nelson TR, Fowlkes JB, Abramowicz JS, Church CC. Ultrasound biosafety considerations for the practicing sonographer and sonologist. J Ultrasound Med. 2009 Feb;28(2):139–50. doi: 10.7863/jum.2009.28.2.139. PMID: 19168764.
- Jensen JA. Estimation of blood velocities using ultrasound: A signal processing approach. New York: Cambridge University Press; 1996. 317 p.
- Ter Haar G. Ultrasonic imaging: Safety considerations. Interface Focus. 2011 Aug 6;1(4):686–97. doi: 10.1098/rsfs.2011.0029. Epub 2011 May 25. PMID: 22866238; PMCID: PMC3262273.
- Goss SA, Johnston RL, Dunn F. Comprehensive compilation of empirical ultrasonic properties of mammalian tissues. J Acoust Soc Am. 1978 Aug;64(2):423–57. doi: 10.1121/1.382016. PMID: 361793.
- Nelson TR, Fowlkes JB, Abramowicz JS, Church CC. Ultrasound biosafety considerations for the practicing sonographer and sonologist. J Ultrasound Med. 2009 Feb;28(2):139–50. doi: 10.7863/jum.2009.28.2.139. PMID: 19168764. ↵
- Chan VWS. Ultrasound Imaging for Regional Anesthesia. 2nd ed. Toronto, ON: Toronto Printing Company; 2009. 202 p. ↵
- Jensen JA. Estimation of blood velocities using ultrasound: A signal processing approach. New York: Cambridge University Press; 1996. 317 p. ↵
- Ter Haar G. Ultrasonic imaging: Safety considerations. Interface Focus. 2011 Aug 6;1(4):686–97. doi: 10.1098/rsfs.2011.0029. Epub 2011 May 25. PMID: 22866238; PMCID: PMC3262273. ↵
- Goss SA, Johnston RL, Dunn F. Comprehensive compilation of empirical ultrasonic properties of mammalian tissues. J Acoust Soc Am. 1978 Aug;64(2):423–57. doi: 10.1121/1.382016. PMID: 361793. ↵
- Goss SA, Johnston RL, Dunn F. Comprehensive compilation of empirical ultrasonic properties of mammalian tissues. J Acoust Soc Am. 1978 Aug;64(2):423–57. doi: 10.1121/1.382016. PMID: 361793. ↵
